
Optimism: bullish momentum and strong support drive a sharp 19.76% gain

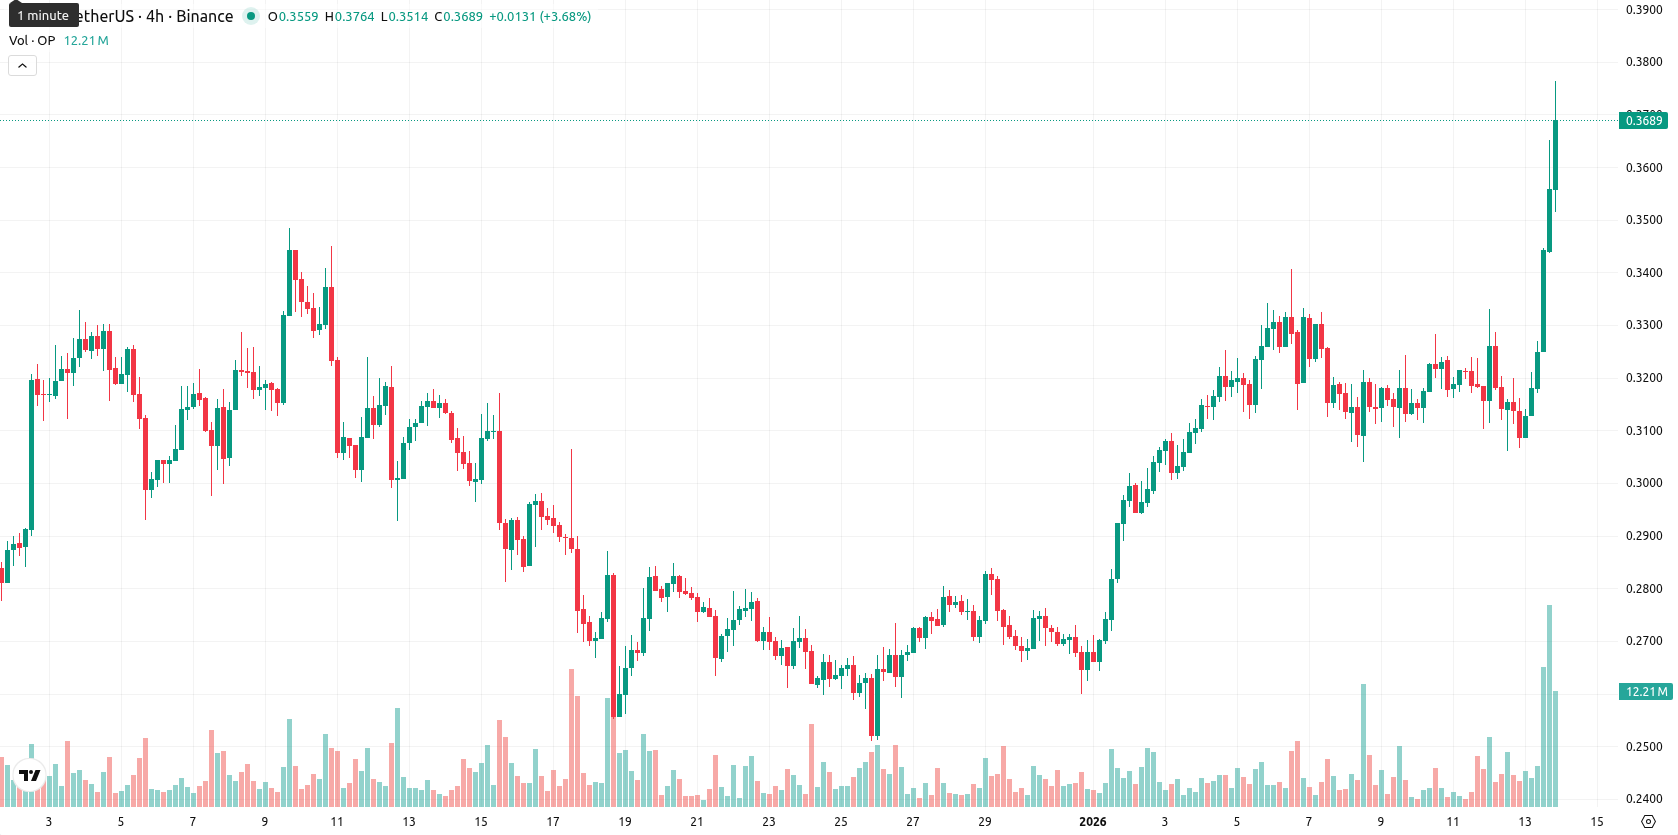
Optimism (OP) is trading at $0.3697, currently above the MA-20 ($0.2964) and MA-50 ($0.3017) but well below the MA-200 ($0.5389), signaling a short-term and medium-term bullish structure while long-term pressure persists.
Highlights
- OP trades at $0.3697, above MA-20 ($0.2964) and MA-50 ($0.3017) but well below MA-200 ($0.5389), indicating short- and medium-term bullishness amid long-term bearish pressure.
- Momentum signals—including MACD buy, ADX trend confirmation, and a neutral-to-mildly overbought oscillator set—support buyer strength, with intraday Bull/Bear Power showing strong buyer dominance.
- Next five-day range is expected between $0.3300 and $0.4100, with less than 20% probability of a price increase; baseline scenario sees stabilization within $0.33–$0.41.
Bullish momentum intensifies as technical boundaries approach
The nearest dynamic support is indicated by the Ichimoku Kijun at $0.2958, while resistance could be found at the MA-50 level or around the next round number near $0.3700. Momentum indicators on the daily chart are bullish, as shown by a MACD buy signal and an ADX value confirming a strengthening positive trend. Overbought risk appears mild, with the RSI at 52.4 and CCI in moderate buy territory, while the Stochastic RSI is neutral, suggesting no immediate reversal. Bull/Bear Power signals strong buyer dominance intraday, and the Awesome Oscillator is neutral but not in conflict with the prevailing upside. The day opened flat with no gap from the previous close, and the current price is close to today’s high, highlighting high volatility and strength in buyers’ tone as the session progressed.
Downside risks increase amid weak buy signals for OP
Over the next five trading days, the expected range is adjusted to $0.3300 to $0.4100, keeping within 10%–11% from the current price as a typical volatility band relative to current levels. Given a lack of weekly buy signals among the primary momentum and trend indicators, the probability of a further price increase is very low (less than 20%), making a move lower more likely. In the baseline scenario, OP stabilizes within the $0.33–$0.41 corridor. A bullish scenario would see a sustained break above resistance near $0.3700, opening the path toward $0.4100, while a bearish scenario would trigger if the price falls below support at $0.3300, targeting a retreat toward $0.31–$0.30.
Previously it was reported that Optimism (OP) is showing strong short- and medium-term bullish momentum, trading above its MA-20 and MA-50 but remaining below the MA-200, with core momentum indicators such as MACD and ADX providing buy signals. Momentum remains firmly with buyers as the asset approaches session highs, though RSI and CCI indicate a positive but non-extreme zone and short-term caution is warranted due to possible overbought conditions on the intraday Stoch RSI.


Latest Optimism News


-
 Afghanistan
-
 Albania
-
 Algeria
-
 Angola
-
 Argentina
-
 Armenia
-
 Australia
-
 Austria
-
 Azerbaijan
-
 Bahamas
-
 Bahrain
-
 Bangladesh
-
 Belarus
-
 Belgium
-
 Bolivia
-
 Botswana
-
 Brazil
-
 Brunei
-
 Bulgaria
-
 Cambodia
-
 Cameroon
-
 Canada
-
 Chile
Chile
-
 China
China
-
 Colombia
-
 Congo
Congo
-
 Costa Rica
-
 Cote d'Ivoire
-
 Croatia
-
 Cuba
Cuba
-
 Cyprus
-
 Czechia
-
 DR Congo
-
 Denmark
-
 Dominican Republic
-
 Ecuador
-
 Egypt
Egypt
-
 El Salvador
-
 Estonia
-
 Eswatini
-
 Ethiopia
-
 Finland
-
 France
-
 Georgia
-
 Germany
-
 Ghana
Ghana
-
 Greece
-
 Haiti
Haiti
-
 Hong Kong
-
 Hungary
-
 India
India
-
 Indonesia
-
 Iran, Islamic republic
-
 Iraq
Iraq
-
 Ireland
-
 Israel
-
 Italy
Italy
-
 Jamaica
-
 Japan
Japan
-
 Jordan
-
 Kazakhstan
-
 Kenya
Kenya
-
 Korea
Korea
-
 Kuwait
-
 Kyrgyzstan
-
 Laos
Laos
-
 Latvia
-
 Lebanon
-
 Lesotho
-
 Libya
Libya
-
 Lithuania
-
 Luxembourg
-
 Madagascar
-
 Malaysia
-
 Malta
Malta
-
 Mauritius
-
 Mexico
-
 Moldova
-
 Mongolia
-
 Montenegro
-
 Morocco
-
 Mozambique
-
 Myanmar
-
 Namibia
-
 Nepal
Nepal
-
 Netherlands
-
 New Zealand
-
 Nigeria
-
 North Macedonia
-
 Norway
-
 Oman
Oman
-
 Pakistan
-
 Palestine
-
 Panama
-
 Papua New Guinea
-
 Paraguay
-
 Peru
Peru
-
 Philippines
-
 Poland
-
 Portugal
-
 Puerto Rico
-
 Qatar
Qatar
-
 Reunion
-
 Romania
-
 Rwanda
-
 Saudi Arabia
-
 Serbia
-
 Singapore
-
 Slovakia
-
 Slovenia
-
 Somalia
-
 South Africa
-
 Spain
Spain
-
 Sri Lanka
-
 Sweden
-
 Switzerland
-
 Syria
Syria
-
 Taiwan
-
 Tajikistan
-
 Tanzania
-
 Thailand
-
 Trinidad and Tobago
-
 Tunisia
-
 Turkey
-
 UAE
UAE
-
 Uganda
-
 Ukraine
-
 United Kingdom
-
United States
-
 Uruguay
-
 Uzbekistan
-
 Venezuela
-
 Vietnam
-
 Yemen
Yemen
-
 Zambia
-
 Zimbabwe
- Forex
- Crypto
