
Cardano price prediction: Downside risks dominate as ADA loses 5.55%

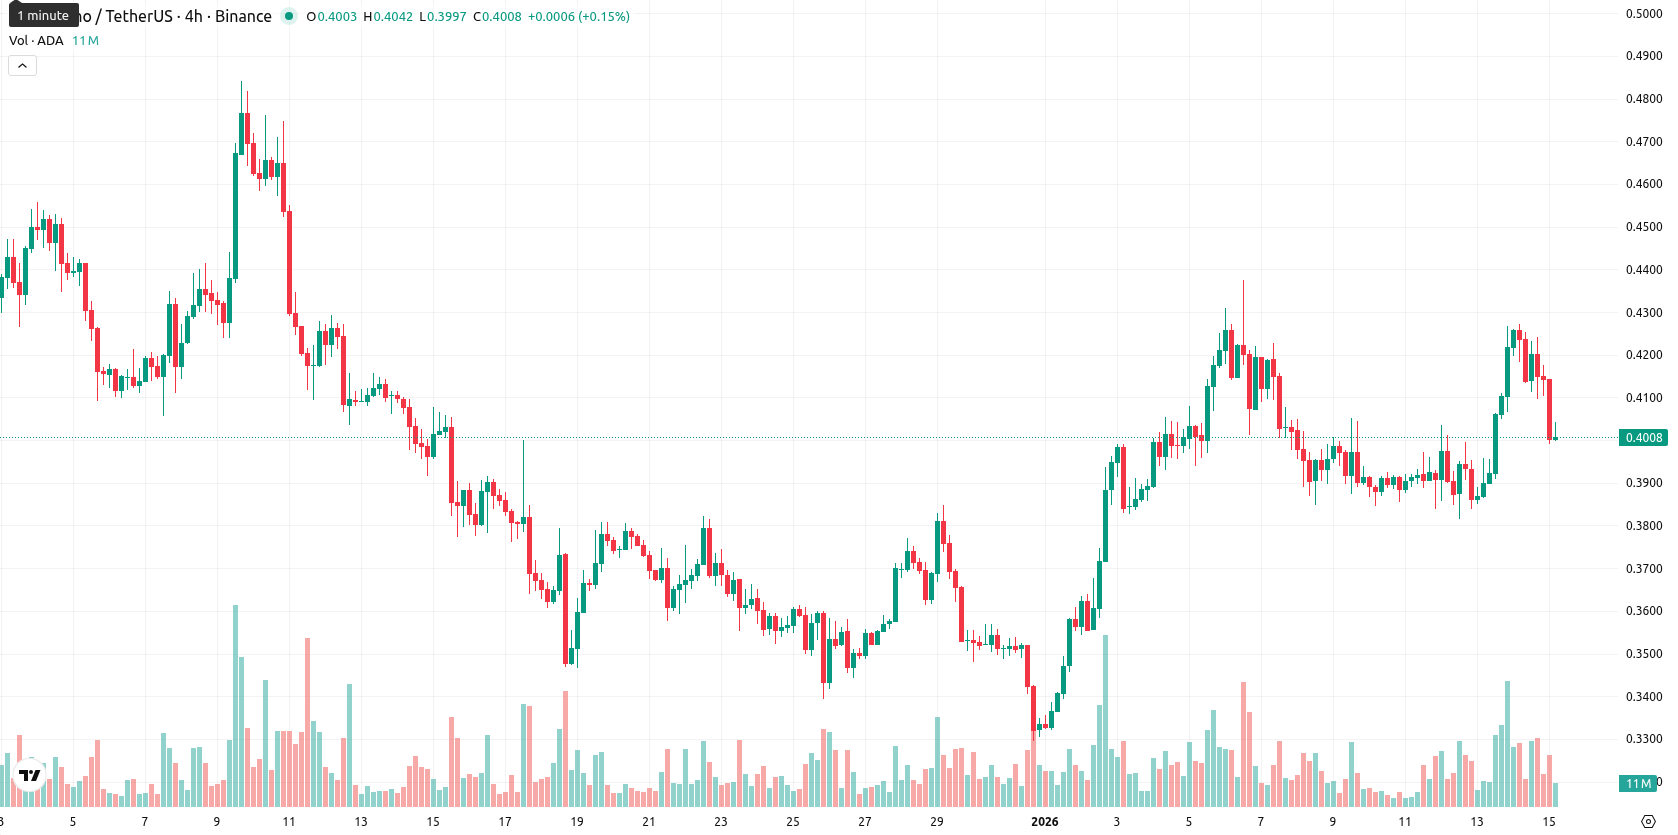
Cardano (ADA) is trading at $0.401, which is above its MA-20 ($0.385) and MA-50 ($0.396), yet well below the long-term MA-200 ($0.648). This structure shows some short-term upward momentum, but longer-term resistance persists, with the nearest dynamic support at the Ichimoku Kijun ($0.383) and immediate resistance likely at the MA-50 and the $0.41 area.
 0.178
0.172
0.178
0.172
Highlights
- Germany's DZ Bank secured MiCAR approval, enabling regulated European banks to offer Cardano (ADA) trading to institutional clients on its meinKrypto platform.
- Cardano advanced its governance roadmap with an ongoing community vote to name the 2026 Protocol Version 11 upgrade, signaling continued stakeholder engagement.
- The ecosystem saw sustained technical improvements, including progress on the Leios scaling protocol and the enterprise-focused Midnight sidechain, underpinning network development.
Institutional access grows as DZ Bank approval lifts sentiment
Cardano recently gained traction as Germany's DZ Bank received MiCAR approval, allowing regulated European banks to offer ADA trading to institutional clients and introducing Cardano to its meinKrypto trading platform. The network also advanced its governance roadmap, with an ongoing community vote to name the upcoming 2026 Protocol Version 11 upgrade and continued technical improvements, including the Leios scaling protocol and the enterprise-focused Midnight sidechain. These developments underscore growing institutional access and sustained ecosystem upgrades.
Buyer momentum diverges as overbought signals spark caution
Momentum indicators on the daily timeframe are mixed. The MACD and ADX signal ongoing buying interest, but oscillators such as the RSI (near 56), Stochastic RSI (overbought), and CCI (overbought) highlight risk of exhaustion. Bull/Bear Power is slightly positive but not strongly bullish, suggesting mild buyer dominance intraday. The Awesome Oscillator also aligns with an upward bias. The price opened at $0.414, just below the previous close of $0.425, showing a modest gap down and has since dropped 5.55% to near the low of today’s range ($0.399 – $0.414). This points to high volatility and intraday pressure after the open, with sellers controlling the session. While momentum indicators favor buyers, overbought conditions and intraday weakness indicate a clear divergence, signaling caution.
Tight range seen as downside risk overshadows breakout odds
Over the next five trading days, a typical volatility band relative to current levels is projected between $0.380 and $0.420. The probability of a price increase is low (less than 20%), while downside risk is more pronounced. Baseline expectations point to ADA ranging between $0.380 and $0.420, with buyers and sellers in a tight contest. A sustained break above $0.420 could trigger further gains, but a fall below $0.380 would expose lower support — with long-term bearish signals continuing to limit short-term upside potential.
Previously it was reported that Cardano is demonstrating short- and medium-term bullish momentum as it trades above its 20- and 50-day moving averages, though the long-term trend remains bearish with prices well below the 200-day moving average. Key momentum indicators, including elevated but not extreme RSI and CCI alongside neutral MACD and overbought Stoch RSI, suggest the asset is consolidating near resistance, with limited near-term upside and risk of volatility as support holds near recent levels.


Latest Cardano (ADA) News







-
 Afghanistan
-
 Albania
-
 Algeria
-
 Angola
-
 Argentina
-
 Armenia
-
 Australia
-
 Austria
-
 Azerbaijan
-
 Bahamas
-
 Bahrain
-
 Bangladesh
-
 Belarus
-
 Belgium
-
 Bolivia
-
 Botswana
-
 Brazil
-
 Brunei
-
 Bulgaria
-
 Cambodia
-
 Cameroon
-
 Canada
-
 Chile
Chile
-
 China
China
-
 Colombia
-
 Congo
Congo
-
 Costa Rica
-
 Cote d'Ivoire
-
 Croatia
-
 Cuba
Cuba
-
 Cyprus
-
 Czechia
-
 DR Congo
-
 Denmark
-
 Dominican Republic
-
 Ecuador
-
 Egypt
Egypt
-
 El Salvador
-
 Estonia
-
 Eswatini
-
 Ethiopia
-
 Finland
-
 France
-
 Georgia
-
 Germany
-
 Ghana
Ghana
-
 Greece
-
 Haiti
Haiti
-
 Hong Kong
-
 Hungary
-
 India
India
-
 Indonesia
-
 Iran, Islamic republic
-
 Iraq
Iraq
-
 Ireland
-
 Israel
-
 Italy
Italy
-
 Jamaica
-
 Japan
Japan
-
 Jordan
-
 Kazakhstan
-
 Kenya
Kenya
-
 Korea
Korea
-
 Kuwait
-
 Kyrgyzstan
-
 Laos
Laos
-
 Latvia
-
 Lebanon
-
 Lesotho
-
 Libya
Libya
-
 Lithuania
-
 Luxembourg
-
 Madagascar
-
 Malaysia
-
 Malta
Malta
-
 Mauritius
-
 Mexico
-
 Moldova
-
 Mongolia
-
 Montenegro
-
 Morocco
-
 Mozambique
-
 Myanmar
-
 Namibia
-
 Nepal
Nepal
-
 Netherlands
-
 New Zealand
-
 Nigeria
-
 North Macedonia
-
 Norway
-
 Oman
Oman
-
 Pakistan
-
 Palestine
-
 Panama
-
 Papua New Guinea
-
 Paraguay
-
 Peru
Peru
-
 Philippines
-
 Poland
-
 Portugal
-
 Puerto Rico
-
 Qatar
Qatar
-
 Reunion
-
 Romania
-
 Rwanda
-
 Saudi Arabia
-
 Serbia
-
 Singapore
-
 Slovakia
-
 Slovenia
-
 Somalia
-
 South Africa
-
 Spain
Spain
-
 Sri Lanka
-
 Sweden
-
 Switzerland
-
 Syria
Syria
-
 Taiwan
-
 Tajikistan
-
 Tanzania
-
 Thailand
-
 Trinidad and Tobago
-
 Tunisia
-
 Turkey
-
 UAE
UAE
-
 Uganda
-
 Ukraine
-
 United Kingdom
-
United States
-
 Uruguay
-
 Uzbekistan
-
 Venezuela
-
 Vietnam
-
 Yemen
Yemen
-
 Zambia
-
 Zimbabwe
- Forex
- Crypto












