
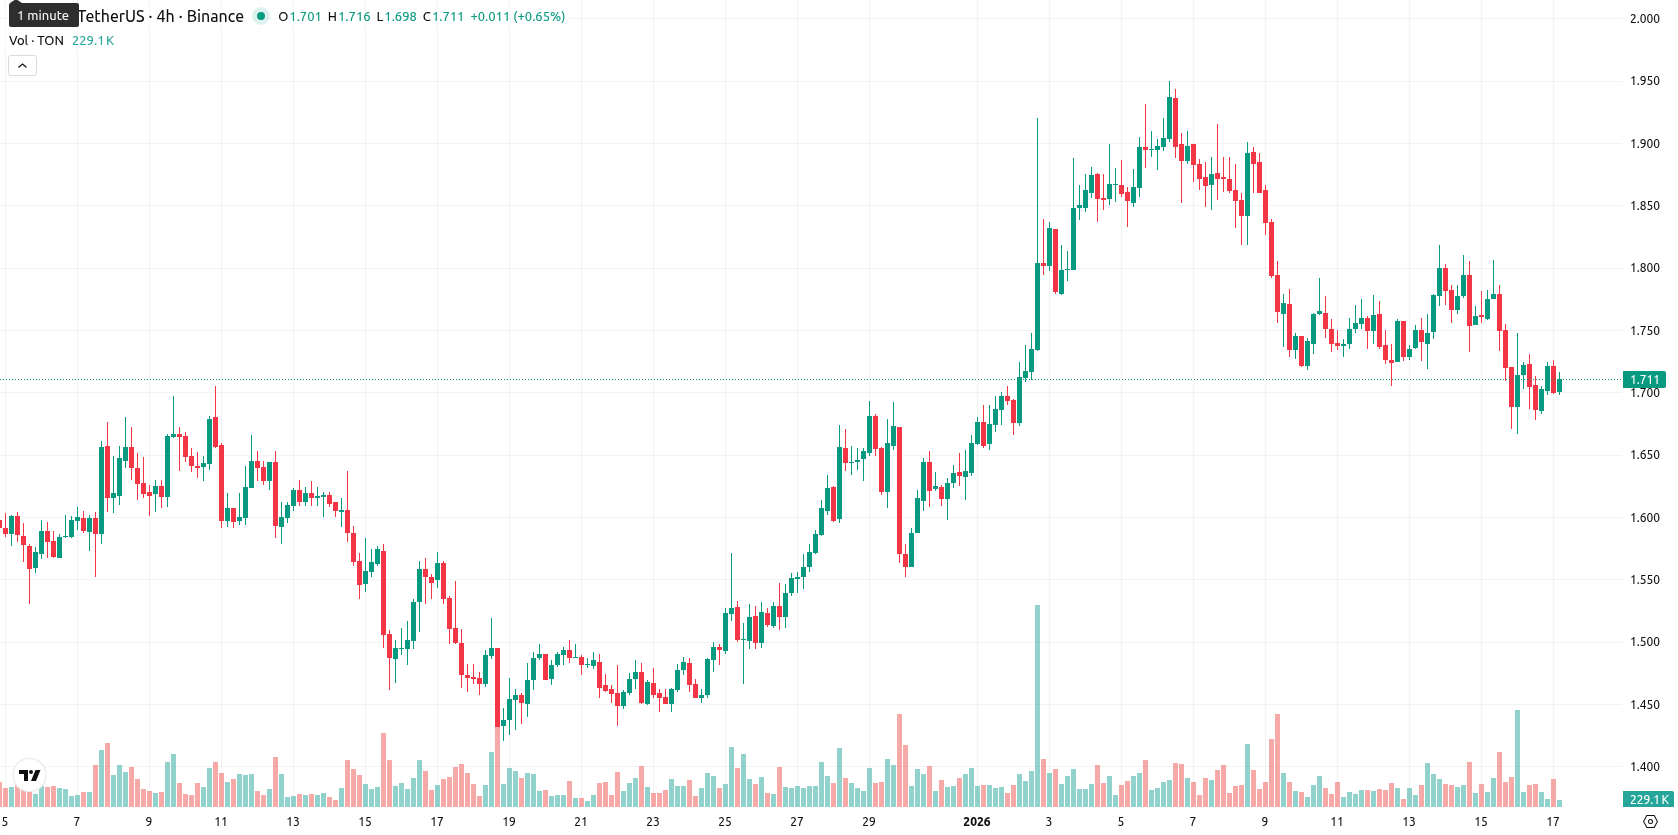
TON weekly analysis: support at $1.66 holds as sellers dominate, resistance at $1.76 looms

Toncoin (TON) is currently priced at $1.714, down 2.02% from the previous week, reflecting a steady but controlled decline within the recent $0.154 trading range. The asset remains well below its weekly MA-20 ($2.123) and MA-50 ($2.797), showing persistent bearish momentum in the medium- and long-term outlook.
Highlights
- Toncoin active addresses increased roughly 300% year-over-year, driven by ongoing integration with Telegram and robust user adoption after the WhatsApp ban in Russia.
- Ecosystem activity surged this week, as the migration of Russian users to Telegram amplified use of TON-based crypto services and reinforced Toncoin's relevance within the sector.
- Following last year’s bull run linked to Telegram, Toncoin’s ecosystem momentum remains high, supported by continued growth in user engagement across the platform.
Ecosystem growth accelerates as Telegram integration drives user surge
A key driver for Toncoin this week is its ongoing integration with Telegram, which has fueled a sharp increase of around 300% year-over-year in active addresses and indicates substantial user adoption. The migration of Russian users to Telegram after the WhatsApp ban has further bolstered the ecosystem, connecting more users to TON-based crypto services. Ecosystem activity surged after last year's celebrated bull run tied to its Telegram association, amplifying Toncoin's relevance in the crypto sector.
Bearish technical signals deepen as momentum indicators confirm selling
Weekly technical signals for TON remain negative. The price is entrenched below both the MA-20 and MA-50, and the Ichimoku Kijun resistance at $2.149 looms overhead. Momentum indicators reinforce the bearish structure, with MACD and CCI showing strong downtrends, ADX confirming persistent selling pressure, and RSI near 37 remaining weak but not yet oversold. Stoch RSI’s overbought reading hints that recent rallies may not hold, while BBP and the neutral Awesome Oscillator suggest continued dominance by sellers and a lack of trend reversal, despite moderate volatility throughout the week.
Sideways range likely as bearish signals and volatility limit upside
For the coming week, Toncoin is expected to move mostly sideways within a range of $1.66 to $1.76, reflecting prevailing bearish signals and moderate volatility. The probability of a meaningful price increase remains low, with technicals favoring continued consolidation or further weakness. If the asset breaks above $1.76, a test of resistance at the Ichimoku Kijun ($2.149) could follow, but a move below $1.66 would open up additional downside risk. The baseline forecast anticipates muted upside and persistent downward bias barring a decisive shift in market sentiment.
Previously, it was noted that momentum signals were mixed, with oversold oscillators hinting at potential relief amid prevailing downside. The main scenario described was sideways movement between key levels, with a bullish breakdown requiring a sustained move above resistance.


-
 Afghanistan
-
 Albania
-
 Algeria
-
 Angola
-
 Argentina
-
 Armenia
-
 Australia
-
 Austria
-
 Azerbaijan
-
 Bahamas
-
 Bahrain
-
 Bangladesh
-
 Belarus
-
 Belgium
-
 Bolivia
-
 Botswana
-
 Brazil
-
 Brunei
-
 Bulgaria
-
 Cambodia
-
 Cameroon
-
 Canada
-
 Chile
Chile
-
 China
China
-
 Colombia
-
 Congo
Congo
-
 Costa Rica
-
 Cote d'Ivoire
-
 Croatia
-
 Cuba
Cuba
-
 Cyprus
-
 Czechia
-
 DR Congo
-
 Denmark
-
 Dominican Republic
-
 Ecuador
-
 Egypt
Egypt
-
 El Salvador
-
 Estonia
-
 Eswatini
-
 Ethiopia
-
 Finland
-
 France
-
 Georgia
-
 Germany
-
 Ghana
Ghana
-
 Greece
-
 Haiti
Haiti
-
 Hong Kong
-
 Hungary
-
 India
India
-
 Indonesia
-
 Iran, Islamic republic
-
 Iraq
Iraq
-
 Ireland
-
 Israel
-
 Italy
Italy
-
 Jamaica
-
 Japan
Japan
-
 Jordan
-
 Kazakhstan
-
 Kenya
Kenya
-
 Korea
Korea
-
 Kuwait
-
 Kyrgyzstan
-
 Laos
Laos
-
 Latvia
-
 Lebanon
-
 Lesotho
-
 Libya
Libya
-
 Lithuania
-
 Luxembourg
-
 Madagascar
-
 Malaysia
-
 Malta
Malta
-
 Mauritius
-
 Mexico
-
 Moldova
-
 Mongolia
-
 Montenegro
-
 Morocco
-
 Mozambique
-
 Myanmar
-
 Namibia
-
 Nepal
Nepal
-
 Netherlands
-
 New Zealand
-
 Nigeria
-
 North Macedonia
-
 Norway
-
 Oman
Oman
-
 Pakistan
-
 Palestine
-
 Panama
-
 Papua New Guinea
-
 Paraguay
-
 Peru
Peru
-
 Philippines
-
 Poland
-
 Portugal
-
 Puerto Rico
-
 Qatar
Qatar
-
 Reunion
-
 Romania
-
 Rwanda
-
 Saudi Arabia
-
 Serbia
-
 Singapore
-
 Slovakia
-
 Slovenia
-
 Somalia
-
 South Africa
-
 Spain
Spain
-
 Sri Lanka
-
 Sweden
-
 Switzerland
-
 Syria
Syria
-
 Taiwan
-
 Tajikistan
-
 Tanzania
-
 Thailand
-
 Trinidad and Tobago
-
 Tunisia
-
 Turkey
-
 UAE
UAE
-
 Uganda
-
 Ukraine
-
 United Kingdom
-
United States
-
 Uruguay
-
 Uzbekistan
-
 Venezuela
-
 Vietnam
-
 Yemen
Yemen
-
 Zambia
-
 Zimbabwe
- Forex
- Crypto
