
Downward bias for Shiba Inu — sideways trading expected amid mixed indicators

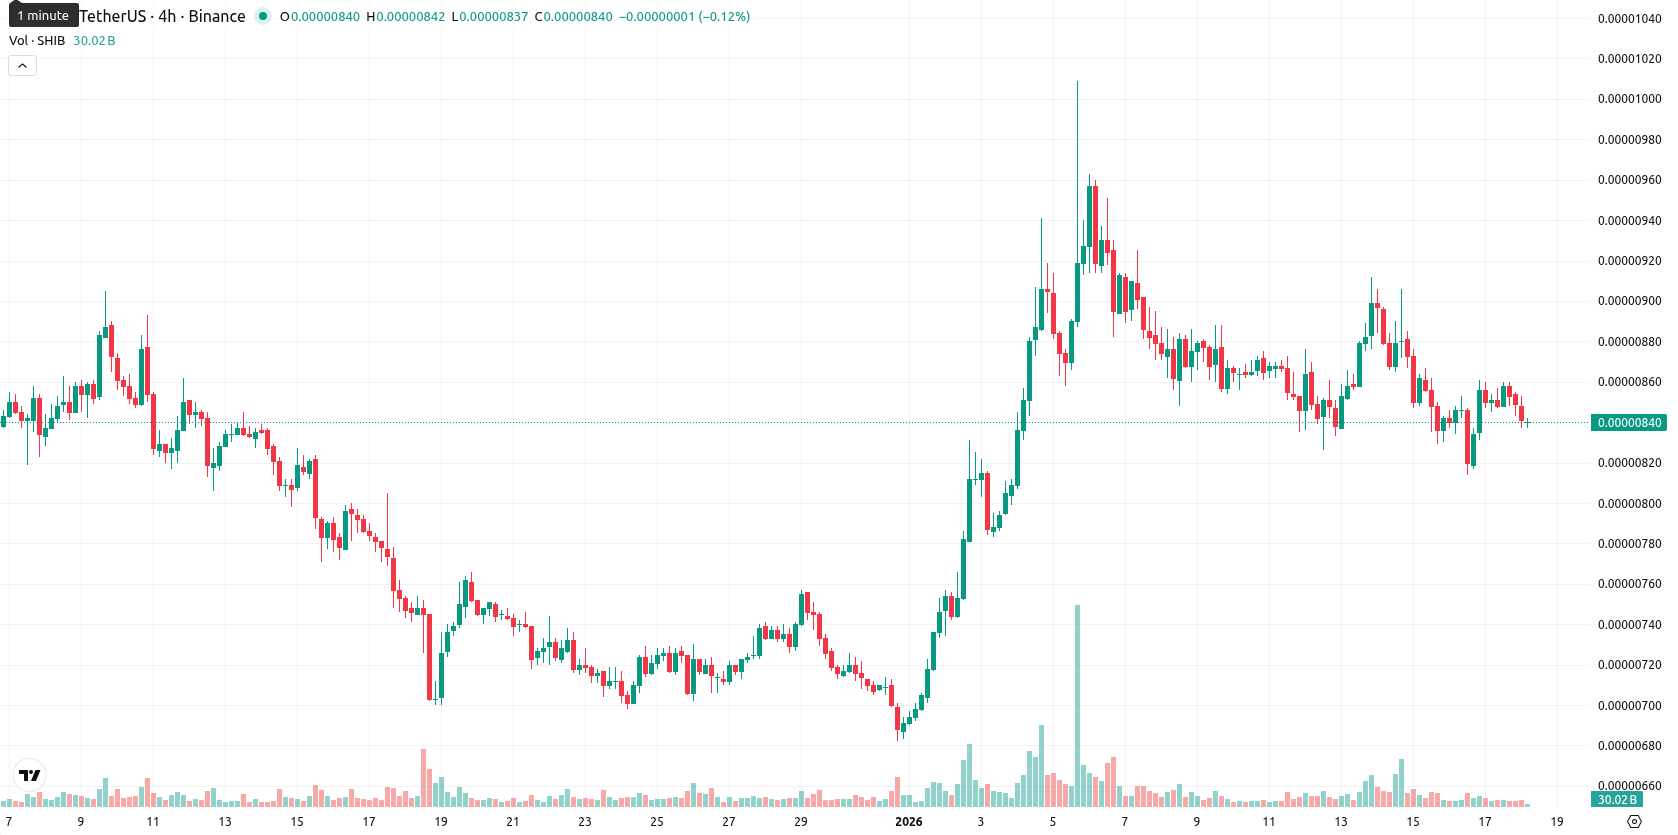
Shiba Inu (SHIB) is trading below the MA-20 ($0.00000835) but just above the MA-50 ($0.00000810), staying well under the MA-200 ($0.00001084). This combination signals continued pressure from sellers in both the short and long term, with price action pressed toward the lower end of today’s range.
Highlights
- SHIB trades below the MA-20 ($0.00000835), just above the MA-50 ($0.00000810), and remains well beneath the MA-200 ($0.00001084), indicating ongoing selling pressure.
- Short-term indicators are mixed, with MACD showing bullish momentum, ADX hinting at an emerging trend, while RSI and Stochastic RSI signal oversold conditions and daily price softness of 1.06% down from open.
- Over the next five trading days, SHIB is expected to remain range-bound between $0.00000770 and $0.00000830, with a bearish tilt and less than 20% probability of a sustained price increase.
Mixed signals persist amid oversold readings and waning volatility
Momentum indicators present a mixed picture on the daily timeframe. The MACD points to strong bullish momentum, while the ADX hints at a possible emerging trend. Conversely, the RSI and Stochastic RSI both indicate oversold conditions, which may set up SHIB for a short-term bounce or some sideways movement. The Bull/Bear Power suggests mild buyer advantage, yet the daily drift lower and minor volatility reflect lingering downward pressure. Importantly, the Ichimoku Kijun at $0.00000849 acts as immediate resistance and the MA-50 near $0.00000810 is the nearest dynamic support, highlighting uncertainty as price softness persists despite some underlying reversal potential.
Bearish range favored as breakout odds remain subdued
Over the next five trading days, SHIB is forecast to move within a typical volatility band between $0.00000770 and $0.00000830. The likelihood of an upward breakout remains low — below 20% — with sideways price action within this range the baseline expectation. A sustained close above $0.00000849 could set up a move to $0.00000830, while a break below $0.00000810 support would put $0.00000770 in focus. For now, the outlook favors a slightly bearish, range-bound scenario unless momentum turns decisively more positive.
Last time, analysts noted that Shiba Inu is showing a short-term bullish bias above key short-term moving averages, but remains well below its long-term trend, with mixed daily momentum signals and strong intraday buyer dominance counterbalanced by persistent low volatility and oversold oscillators. Consolidation is expected in the near term, with price likely to remain rangebound between dynamic support and resistance, as broader bearish signals outweigh the odds of a decisive breakout.


-
 Afghanistan
-
 Albania
-
 Algeria
-
 Angola
-
 Argentina
-
 Armenia
-
 Australia
-
 Austria
-
 Azerbaijan
-
 Bahamas
-
 Bahrain
-
 Bangladesh
-
 Belarus
-
 Belgium
-
 Bolivia
-
 Botswana
-
 Brazil
-
 Brunei
-
 Bulgaria
-
 Cambodia
-
 Cameroon
-
 Canada
-
 Chile
Chile
-
 China
China
-
 Colombia
-
 Congo
Congo
-
 Costa Rica
-
 Cote d'Ivoire
-
 Croatia
-
 Cuba
Cuba
-
 Cyprus
-
 Czechia
-
 DR Congo
-
 Denmark
-
 Dominican Republic
-
 Ecuador
-
 Egypt
Egypt
-
 El Salvador
-
 Estonia
-
 Eswatini
-
 Ethiopia
-
 Finland
-
 France
-
 Georgia
-
 Germany
-
 Ghana
Ghana
-
 Greece
-
 Haiti
Haiti
-
 Hong Kong
-
 Hungary
-
 India
India
-
 Indonesia
-
 Iran, Islamic republic
-
 Iraq
Iraq
-
 Ireland
-
 Israel
-
 Italy
Italy
-
 Jamaica
-
 Japan
Japan
-
 Jordan
-
 Kazakhstan
-
 Kenya
Kenya
-
 Korea
Korea
-
 Kuwait
-
 Kyrgyzstan
-
 Laos
Laos
-
 Latvia
-
 Lebanon
-
 Lesotho
-
 Libya
Libya
-
 Lithuania
-
 Luxembourg
-
 Madagascar
-
 Malaysia
-
 Malta
Malta
-
 Mauritius
-
 Mexico
-
 Moldova
-
 Mongolia
-
 Montenegro
-
 Morocco
-
 Mozambique
-
 Myanmar
-
 Namibia
-
 Nepal
Nepal
-
 Netherlands
-
 New Zealand
-
 Nigeria
-
 North Macedonia
-
 Norway
-
 Oman
Oman
-
 Pakistan
-
 Palestine
-
 Panama
-
 Papua New Guinea
-
 Paraguay
-
 Peru
Peru
-
 Philippines
-
 Poland
-
 Portugal
-
 Puerto Rico
-
 Qatar
Qatar
-
 Reunion
-
 Romania
-
 Rwanda
-
 Saudi Arabia
-
 Serbia
-
 Singapore
-
 Slovakia
-
 Slovenia
-
 Somalia
-
 South Africa
-
 Spain
Spain
-
 Sri Lanka
-
 Sweden
-
 Switzerland
-
 Syria
Syria
-
 Taiwan
-
 Tajikistan
-
 Tanzania
-
 Thailand
-
 Trinidad and Tobago
-
 Tunisia
-
 Turkey
-
 UAE
UAE
-
 Uganda
-
 Ukraine
-
 United Kingdom
-
United States
-
 Uruguay
-
 Uzbekistan
-
 Venezuela
-
 Vietnam
-
 Yemen
Yemen
-
 Zambia
-
 Zimbabwe
- Forex
- Crypto
