
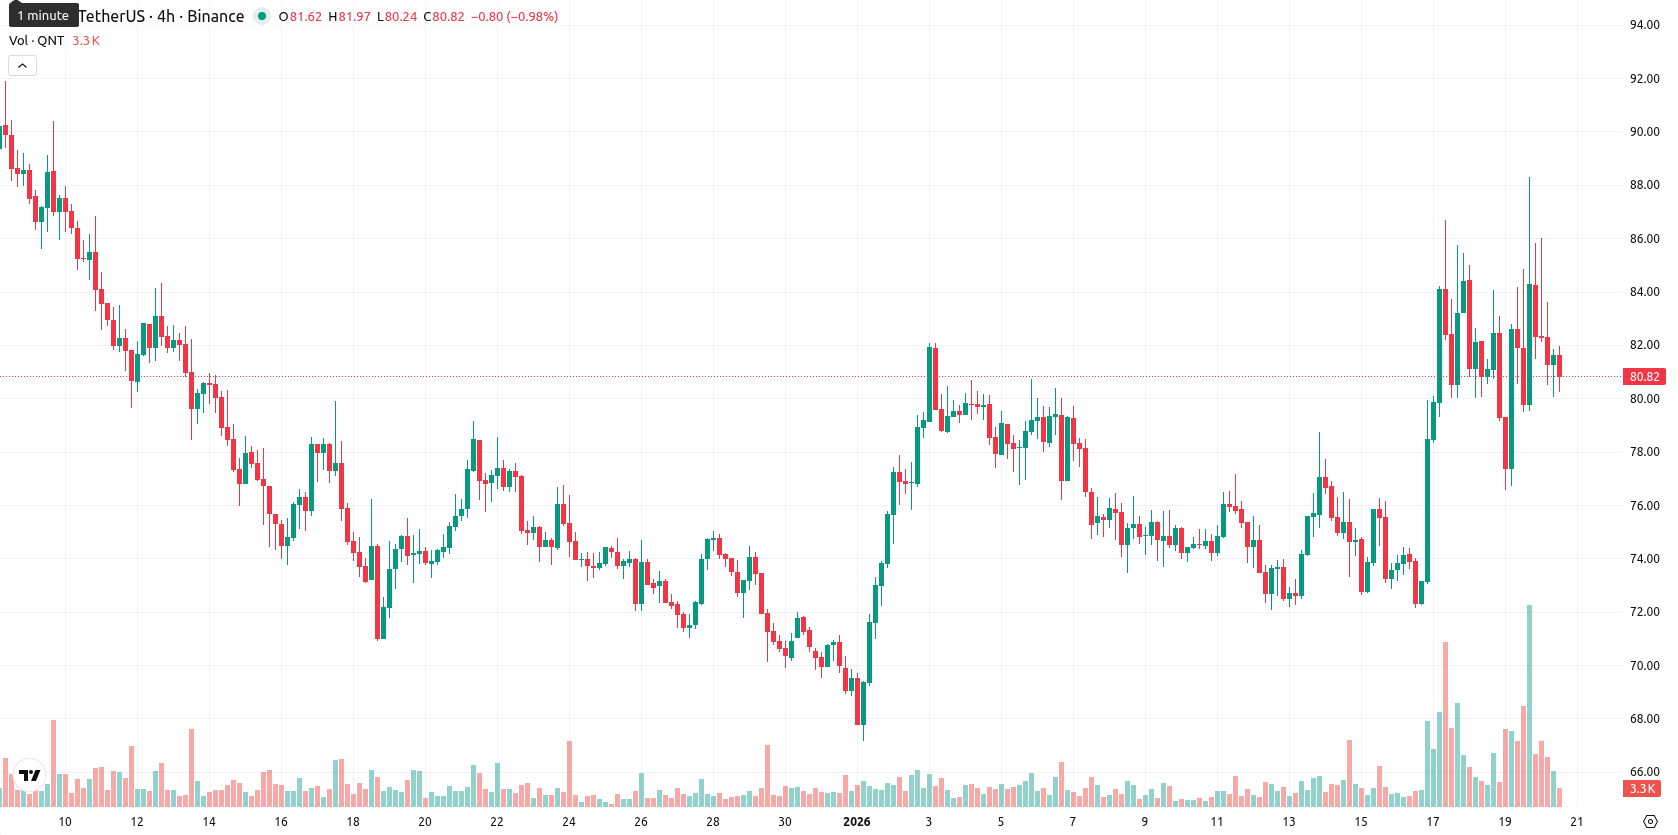
Quant weekly analysis: gains with mixed weekly indicators and rangebound within $72.15 — $88.30

Quant (QNT) is currently trading at $80.69, having gained 1.74% over the past week. The price remains below its weekly MA-20 ($85.73), MA-50 ($92.12), and MA-200 ($100.66), indicating persistent bearish momentum and positioning QNT under key resistance levels on a weekly basis.
Highlights
- Quant saw $569,380 in spot exchange inflows on January 17, marking significant renewed institutional accumulation and heightened engagement over the past week.
- Integration of Overledger OS with major UK banks—HSBC, Barclays, and Lloyds—enables ISO 20022-compliant connectivity across over 45 blockchains, expanding Quant's institutional footprint.
- All 14.88 million QNT tokens remain fully circulating for licensing, payments, and governance, with recent Treasury Reserve distributions reinforcing the project's institutional focus.
Institutional accumulation rises as project expands banking integrations
Quant experienced a notable increase in spot exchange inflows, totaling $569,380 on January 17, signaling renewed institutional accumulation and interest. The project continued to enhance infrastructure and foster partnerships by integrating with major UK banks such as HSBC, Barclays, and Lloyds through its Overledger OS, enabling connectivity across more than 45 blockchains with ISO 20022 compliance. All 14.88 million QNT tokens remain in full circulation and are used for licensing, payments, and governance, with recent Treasury Reserve distributions to holders and stakers further underlining institutional engagement.
Bearish bias persists this week as mixed signals and volatility emerge
On the weekly chart, QNT remains pressured by key moving averages, with dynamic resistance observed at the Ichimoku Kijun level of $91.59. Weekly indicators are mixed: the MACD and RSI signal a bearish outlook, while ADX indicates a lack of strong trend direction. Bull/Bear Power suggests short-term overbought conditions, but other oscillators including weekly CCI and Stoch RSI remain neutral, pointing to indecisive sentiment and heightened volatility within the weekly $72.15–$88.30 range.
Sideways consolidation favored as volatility limits upside next week
For the upcoming 5–7 trading days, QNT is expected to consolidate mostly sideways between $79.60 and $82.10, following the recent period of volatility. Based on weekly indicator signals, the likelihood of further upside is low (less than 20%), favoring a pullback or stabilization above strong support. A confirmed move above $82.10 could prompt a recovery scenario, while a break below $79.60 would indicate renewed downside risk and the potential for retesting lower weekly levels.
Previously it was reported that Quant closed the week lower and remains under persistent bearish pressure, with price trading well below its key moving averages and technical indicators signaling deepening oversold conditions. Analysts anticipated the asset would consolidate sideways within the $68.00–$75.00 range unless a break above resistance was achieved.


-
 Afghanistan
-
 Albania
-
 Algeria
-
 Angola
-
 Argentina
-
 Armenia
-
 Australia
-
 Austria
-
 Azerbaijan
-
 Bahamas
-
 Bahrain
-
 Bangladesh
-
 Belarus
-
 Belgium
-
 Bolivia
-
 Botswana
-
 Brazil
-
 Brunei
-
 Bulgaria
-
 Cambodia
-
 Cameroon
-
 Canada
-
 Chile
Chile
-
 China
China
-
 Colombia
-
 Congo
Congo
-
 Costa Rica
-
 Cote d'Ivoire
-
 Croatia
-
 Cuba
Cuba
-
 Cyprus
-
 Czechia
-
 DR Congo
-
 Denmark
-
 Dominican Republic
-
 Ecuador
-
 Egypt
Egypt
-
 El Salvador
-
 Estonia
-
 Eswatini
-
 Ethiopia
-
 Finland
-
 France
-
 Georgia
-
 Germany
-
 Ghana
Ghana
-
 Greece
-
 Haiti
Haiti
-
 Hong Kong
-
 Hungary
-
 India
India
-
 Indonesia
-
 Iran, Islamic republic
-
 Iraq
Iraq
-
 Ireland
-
 Israel
-
 Italy
Italy
-
 Jamaica
-
 Japan
Japan
-
 Jordan
-
 Kazakhstan
-
 Kenya
Kenya
-
 Korea
Korea
-
 Kuwait
-
 Kyrgyzstan
-
 Laos
Laos
-
 Latvia
-
 Lebanon
-
 Lesotho
-
 Libya
Libya
-
 Lithuania
-
 Luxembourg
-
 Madagascar
-
 Malaysia
-
 Malta
Malta
-
 Mauritius
-
 Mexico
-
 Moldova
-
 Mongolia
-
 Montenegro
-
 Morocco
-
 Mozambique
-
 Myanmar
-
 Namibia
-
 Nepal
Nepal
-
 Netherlands
-
 New Zealand
-
 Nigeria
-
 North Macedonia
-
 Norway
-
 Oman
Oman
-
 Pakistan
-
 Palestine
-
 Panama
-
 Papua New Guinea
-
 Paraguay
-
 Peru
Peru
-
 Philippines
-
 Poland
-
 Portugal
-
 Puerto Rico
-
 Qatar
Qatar
-
 Reunion
-
 Romania
-
 Rwanda
-
 Saudi Arabia
-
 Serbia
-
 Singapore
-
 Slovakia
-
 Slovenia
-
 Somalia
-
 South Africa
-
 Spain
Spain
-
 Sri Lanka
-
 Sweden
-
 Switzerland
-
 Syria
Syria
-
 Taiwan
-
 Tajikistan
-
 Tanzania
-
 Thailand
-
 Trinidad and Tobago
-
 Tunisia
-
 Turkey
-
 UAE
UAE
-
 Uganda
-
 Ukraine
-
 United Kingdom
-
United States
-
 Uruguay
-
 Uzbekistan
-
 Venezuela
-
 Vietnam
-
 Yemen
Yemen
-
 Zambia
-
 Zimbabwe
- Forex
- Crypto
