
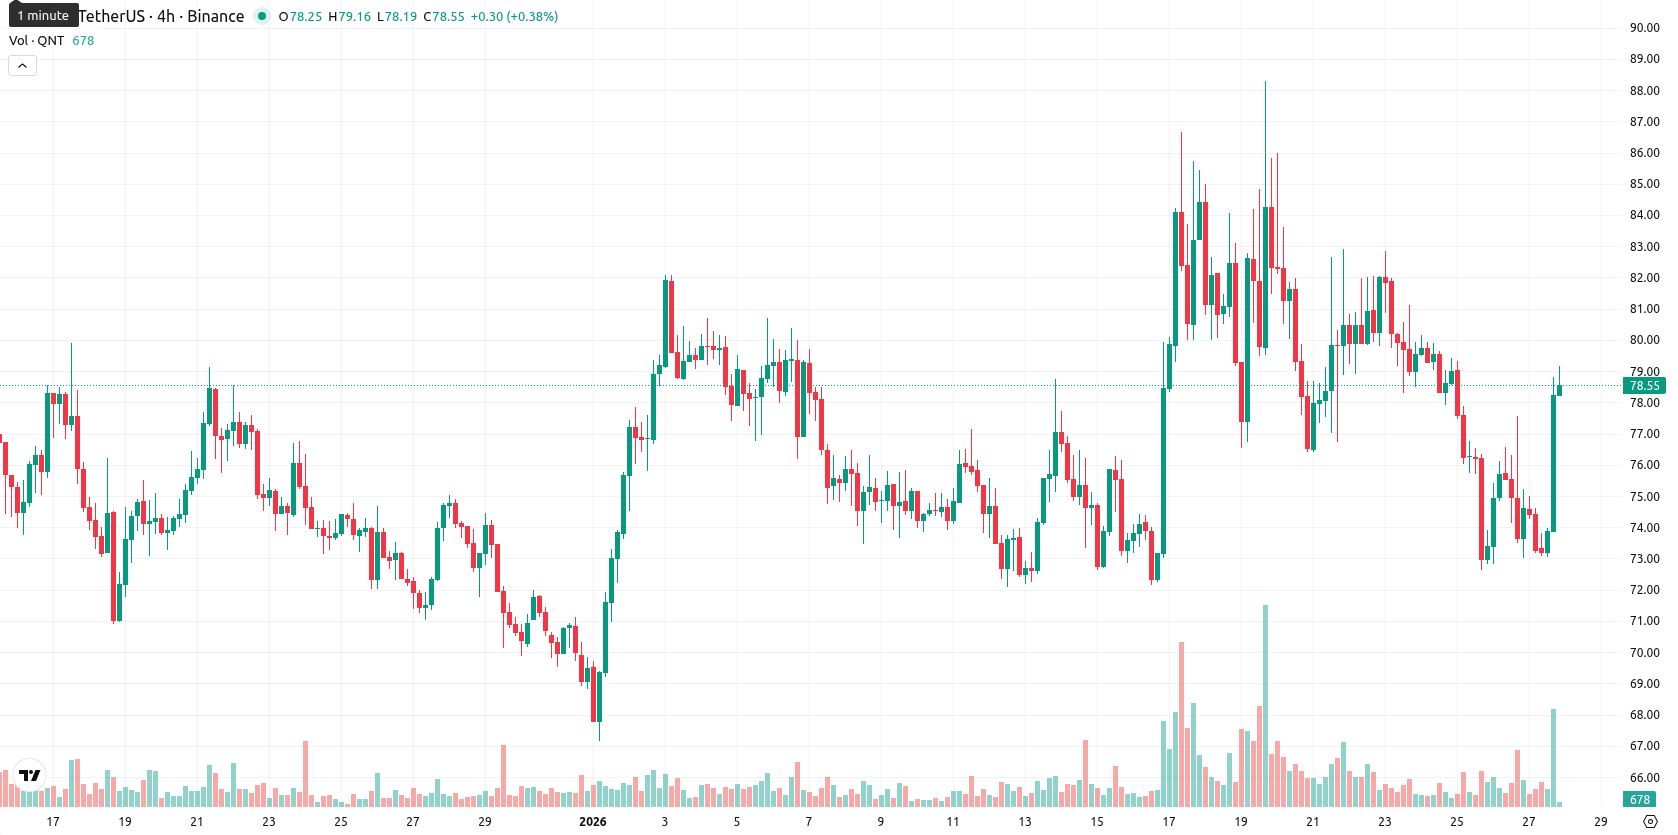
High intraday volatility fuels rally — Quant gains 7.04%

Quant (QNT) is currently trading at $78.65, positioned above both the MA-20 ($77.10) and MA-50 ($76.95) but still well below the longer-term MA-200 ($92.99). This setup signals short- and medium-term recovery momentum, but ongoing longer-term bearish pressure remains, with dynamic resistance now defined by the Ichimoku Kijun near $77.72 and the next resistance seen around the MA-50 or the $80 round level.
Highlights
- QNT is trading at $78.65, above the MA-20 ($77.10) and MA-50 ($76.95) but well below the MA-200 ($92.99), signaling persistent long-term bearish pressure.
- Momentum signals are mixed, with daily MACD and ADX neutral, while RSI and Commodity Channel Index flash sell signals despite a strong 7.04% price surge in the last session.
- QNT is expected to consolidate between $75 and $82 this week, with a breakout above $82.26 required for a bullish move and a break below $74.85 indicating renewed downside.
Divergence among mixed momentum signals as intraday strength emerges
Momentum signals for QNT are mixed, with the daily MACD and ADX both neutral, highlighting an uncertain trend. The RSI and Commodity Channel Index are on sell signals and suggest mild downside pressure, while the Stochastic RSI and Bull/Bear Power both indicate that conditions are oversold, reflecting recent seller dominance. The current price is very close to today’s high, signaling high intraday volatility and strength toward session highs. This strong upward move contrasts with generally neutral-to-bearish momentum readings, confirming notable divergence among short-term indicators.
Bearish outlook favored as major indicators fail to confirm upside
For the next week, QNT’s typical volatility band is $74.85 to $82.26, with the current price near the midpoint. The probability of further price increase is very low (less than 20%), indicating that a decline is more likely given that none of the major weekly indicators (RSI, ADX, MACD, MA-50) are on a buy signal. The primary scenario is consolidation between $75 and $82 as short-term buyers and longer-term sellers balance out, while a break above $82.26 could prompt momentum buying and a bearish break below $74.85 may trigger renewed downside selling.
Previously it was reported that Quant remains under significant downside pressure, trading below all major moving averages with mixed momentum signals, as the daily MACD gives a mild buy indication while ADX points to weak trend strength and RSI is neutral. The asset is expected to consolidate sideways within a narrow volatility band, with resistance at $77.72 and support near $72.00, and limited potential for any meaningful rebound unless key resistance is broken.


-
 Afghanistan
-
 Albania
-
 Algeria
-
 Angola
-
 Argentina
-
 Armenia
-
 Australia
-
 Austria
-
 Azerbaijan
-
 Bahamas
-
 Bahrain
-
 Bangladesh
-
 Belarus
-
 Belgium
-
 Bolivia
-
 Botswana
-
 Brazil
-
 Brunei
-
 Bulgaria
-
 Cambodia
-
 Cameroon
-
 Canada
-
 Chile
Chile
-
 China
China
-
 Colombia
-
 Congo
Congo
-
 Costa Rica
-
 Cote d'Ivoire
-
 Croatia
-
 Cuba
Cuba
-
 Cyprus
-
 Czechia
-
 DR Congo
-
 Denmark
-
 Dominican Republic
-
 Ecuador
-
 Egypt
Egypt
-
 El Salvador
-
 Estonia
-
 Eswatini
-
 Ethiopia
-
 Finland
-
 France
-
 Georgia
-
 Germany
-
 Ghana
Ghana
-
 Greece
-
 Haiti
Haiti
-
 Hong Kong
-
 Hungary
-
 India
India
-
 Indonesia
-
 Iran, Islamic republic
-
 Iraq
Iraq
-
 Ireland
-
 Israel
-
 Italy
Italy
-
 Jamaica
-
 Japan
Japan
-
 Jordan
-
 Kazakhstan
-
 Kenya
Kenya
-
 Korea
Korea
-
 Kuwait
-
 Kyrgyzstan
-
 Laos
Laos
-
 Latvia
-
 Lebanon
-
 Lesotho
-
 Libya
Libya
-
 Lithuania
-
 Luxembourg
-
 Madagascar
-
 Malaysia
-
 Malta
Malta
-
 Mauritius
-
 Mexico
-
 Moldova
-
 Mongolia
-
 Montenegro
-
 Morocco
-
 Mozambique
-
 Myanmar
-
 Namibia
-
 Nepal
Nepal
-
 Netherlands
-
 New Zealand
-
 Nigeria
-
 North Macedonia
-
 Norway
-
 Oman
Oman
-
 Pakistan
-
 Palestine
-
 Panama
-
 Papua New Guinea
-
 Paraguay
-
 Peru
Peru
-
 Philippines
-
 Poland
-
 Portugal
-
 Puerto Rico
-
 Qatar
Qatar
-
 Reunion
-
 Romania
-
 Rwanda
-
 Saudi Arabia
-
 Serbia
-
 Singapore
-
 Slovakia
-
 Slovenia
-
 Somalia
-
 South Africa
-
 Spain
Spain
-
 Sri Lanka
-
 Sweden
-
 Switzerland
-
 Syria
Syria
-
 Taiwan
-
 Tajikistan
-
 Tanzania
-
 Thailand
-
 Trinidad and Tobago
-
 Tunisia
-
 Turkey
-
 UAE
UAE
-
 Uganda
-
 Ukraine
-
 United Kingdom
-
United States
-
 Uruguay
-
 Uzbekistan
-
 Venezuela
-
 Vietnam
-
 Yemen
Yemen
-
 Zambia
-
 Zimbabwe
- Forex
- Crypto
