
Technical selling dominates all timeframes — Quant drops 7.04%

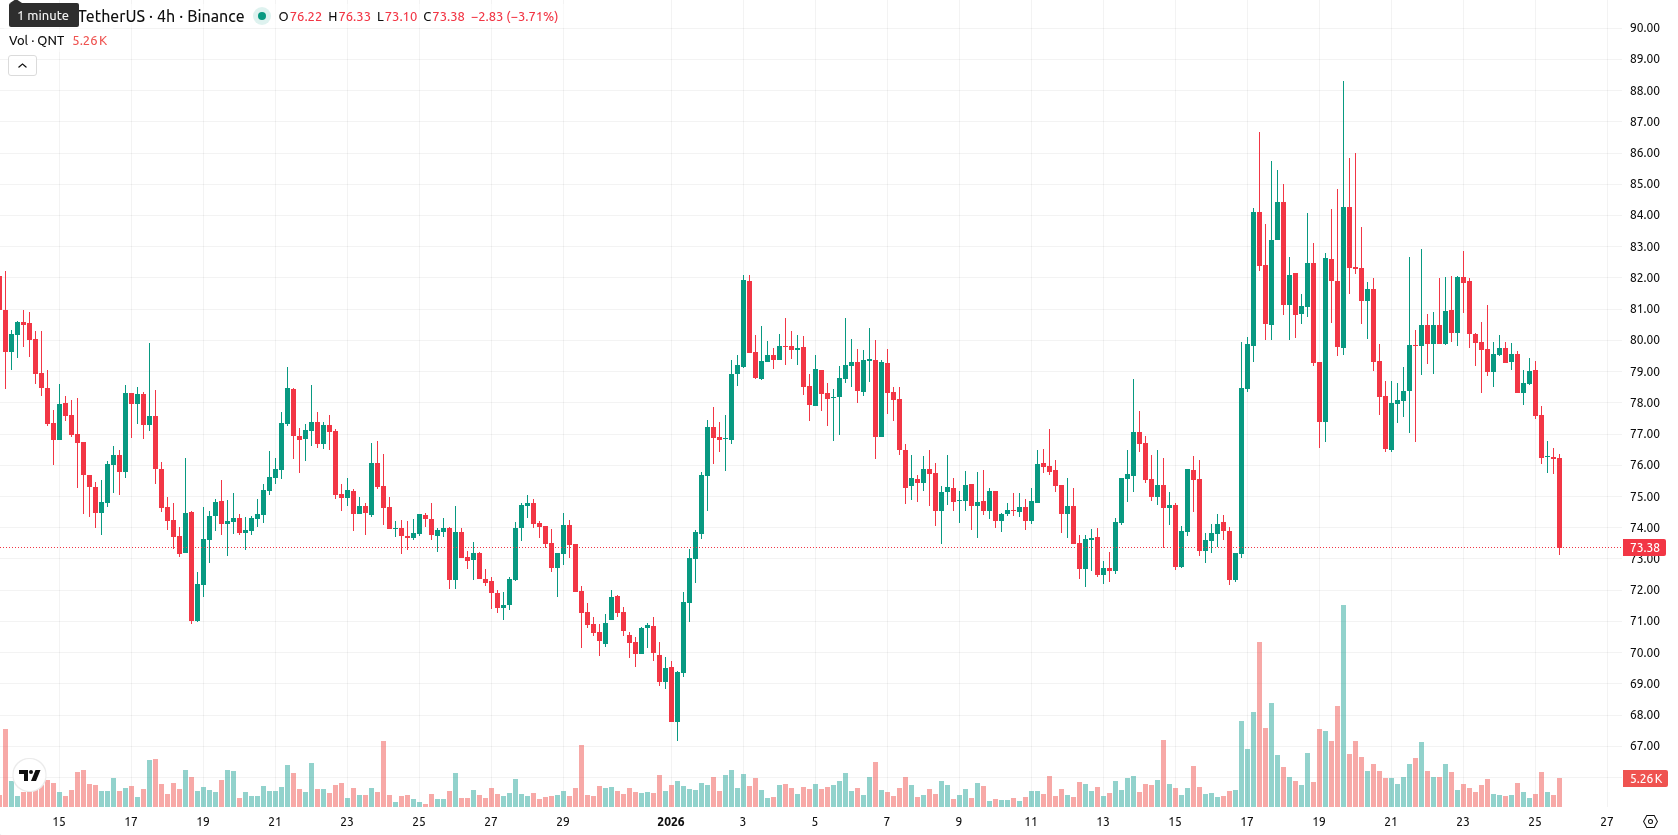
Quant (QNT) is trading at $73.31 following a sharp decline of $5.55, or 7.04%, today. The price currently sits below the MA-20 ($77.63), MA-50 ($77.53), and far below the MA-200 ($93.37), underscoring continuing downside pressure across all observed timeframes.
Highlights
- QNT is trading at $73.31, remaining below its MA-20 ($77.63), MA-50 ($77.53), and MA-200 ($93.37), confirming sustained bearish pressure across all timeframes.
- The nearest resistance is now the Ichimoku Kijun at $77.72, while immediate support is seen near the $72.00 mark amid recent high volatility.
- Despite a modest daily MACD buy signal, persistent selling and weak weekly indicators place the probability of a near-term price increase below 20%.
Network utility supports market cap amid platform governance focus
Quant, which operates as an ERC-20 token on the Ethereum blockchain, serves to pay network fees, enable platform governance, and secure the Overledger Network using proof-of-stake and proof-of-activity mechanisms. Co-founded by Gilbert Verdian and Dr Paolo Tasca, Quant focuses on blockchain interoperability. The asset's current market capitalization is approximately $951.51 million, reflecting ongoing network utility and platform engagement.
Mixed momentum signals as downside trend persists below resistance
QNT’s technical posture reflects strong downside momentum, remaining under its key moving averages on all timeframes. The nearest resistance is the Ichimoku Kijun at $77.72, with potential support around $72.00. Momentum signals are mixed: the daily MACD issues a modest buy signal, the ADX (18.31) points to a weak trend, and the RSI is neutral to slightly positive, though most sub-daily readings show more selling pressure. Stochastic RSI and CCI are neutral on the daily frame, but shorter-term readings indicate oversold conditions, while Bull/Bear Power is overbought on the daily chart yet favors sellers intraday; the Awesome Oscillator adds no direction.
Sideways trading outlook as bearish signals limit rebound potential
Over the coming week, QNT is likely to trade within a typical volatility band of $72.72 – $74.14, closely aligned with the current price. The probability of a price increase remains low (less than 20%), as bearish indicators dominate the weekly chart. Sideways movement within this band is expected unless QNT decisively breaks above $77.72 on renewed momentum, which could enable recovery. A confirmed drop below $72.72 would reinforce the bearish case and invite additional downside risk should broader weekly signals stay negative.
Last time, analysts noted that Quant is currently trading below key weekly moving averages and is facing sustained bearish momentum, with technical indicators such as MACD and RSI maintaining a negative outlook while ADX points to weak trend strength. For the coming week, the asset is expected to consolidate within a narrow range, with limited upside potential unless resistance at $82.10 is surpassed.


-
 Afghanistan
-
 Albania
-
 Algeria
-
 Angola
-
 Argentina
-
 Armenia
-
 Australia
-
 Austria
-
 Azerbaijan
-
 Bahamas
-
 Bahrain
-
 Bangladesh
-
 Belarus
-
 Belgium
-
 Bolivia
-
 Botswana
-
 Brazil
-
 Brunei
-
 Bulgaria
-
 Cambodia
-
 Cameroon
-
 Canada
-
 Chile
Chile
-
 China
China
-
 Colombia
-
 Congo
Congo
-
 Costa Rica
-
 Cote d'Ivoire
-
 Croatia
-
 Cuba
Cuba
-
 Cyprus
-
 Czechia
-
 DR Congo
-
 Denmark
-
 Dominican Republic
-
 Ecuador
-
 Egypt
Egypt
-
 El Salvador
-
 Estonia
-
 Eswatini
-
 Ethiopia
-
 Finland
-
 France
-
 Georgia
-
 Germany
-
 Ghana
Ghana
-
 Greece
-
 Haiti
Haiti
-
 Hong Kong
-
 Hungary
-
 India
India
-
 Indonesia
-
 Iran, Islamic republic
-
 Iraq
Iraq
-
 Ireland
-
 Israel
-
 Italy
Italy
-
 Jamaica
-
 Japan
Japan
-
 Jordan
-
 Kazakhstan
-
 Kenya
Kenya
-
 Korea
Korea
-
 Kuwait
-
 Kyrgyzstan
-
 Laos
Laos
-
 Latvia
-
 Lebanon
-
 Lesotho
-
 Libya
Libya
-
 Lithuania
-
 Luxembourg
-
 Madagascar
-
 Malaysia
-
 Malta
Malta
-
 Mauritius
-
 Mexico
-
 Moldova
-
 Mongolia
-
 Montenegro
-
 Morocco
-
 Mozambique
-
 Myanmar
-
 Namibia
-
 Nepal
Nepal
-
 Netherlands
-
 New Zealand
-
 Nigeria
-
 North Macedonia
-
 Norway
-
 Oman
Oman
-
 Pakistan
-
 Palestine
-
 Panama
-
 Papua New Guinea
-
 Paraguay
-
 Peru
Peru
-
 Philippines
-
 Poland
-
 Portugal
-
 Puerto Rico
-
 Qatar
Qatar
-
 Reunion
-
 Romania
-
 Rwanda
-
 Saudi Arabia
-
 Serbia
-
 Singapore
-
 Slovakia
-
 Slovenia
-
 Somalia
-
 South Africa
-
 Spain
Spain
-
 Sri Lanka
-
 Sweden
-
 Switzerland
-
 Syria
Syria
-
 Taiwan
-
 Tajikistan
-
 Tanzania
-
 Thailand
-
 Trinidad and Tobago
-
 Tunisia
-
 Turkey
-
 UAE
UAE
-
 Uganda
-
 Ukraine
-
 United Kingdom
-
United States
-
 Uruguay
-
 Uzbekistan
-
 Venezuela
-
 Vietnam
-
 Yemen
Yemen
-
 Zambia
-
 Zimbabwe
- Forex
- Crypto
