
Quant weekly forecast: climbs above $80 with buyers showing dominance — resistance near $83.86

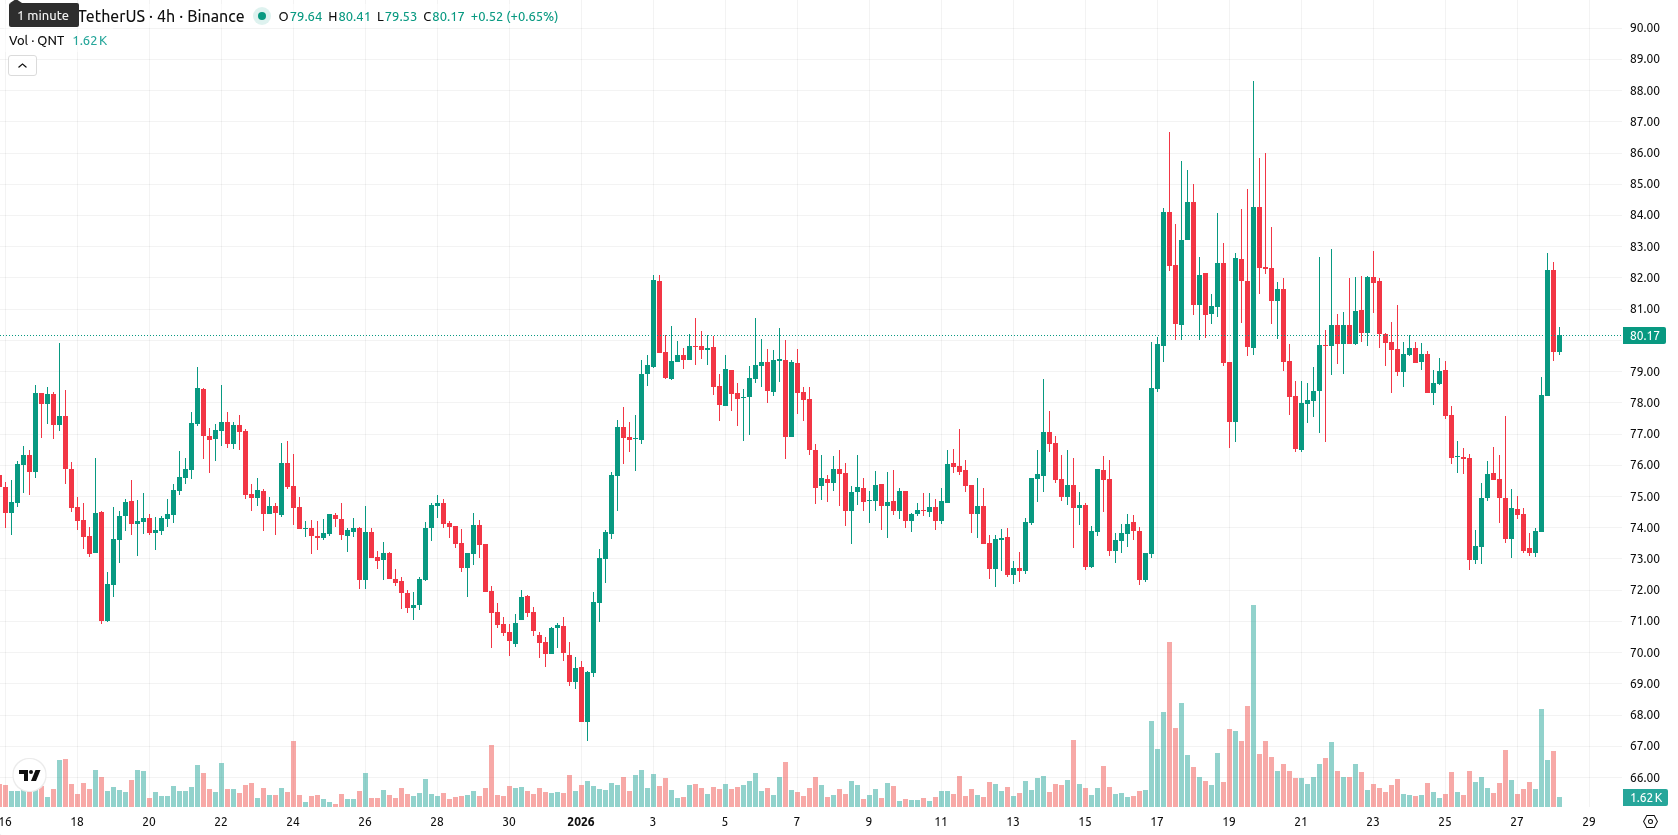
Quant (QNT) is trading at $80.21, showing a gain of $6.33 or 8.57% over the past week. The price is positioned above its weekly MA-20 ($77.45) and MA-50 ($76.83), but remains underneath the MA-200 ($92.84), signaling bullish short- to medium-term trends, yet still facing longer-term technical resistance.
Highlights
- QNT is trading at $80.21, up 8.57% on the day, currently above the MA-20 ($77.45) and MA-50 ($76.83) but below the MA-200 ($92.84).
- Daily momentum signals are bullish with MACD at 'Strong Buy' and buyers dominating intraday, but ADX and weekly trend remain neutral to weak.
- The expected price range for the next five sessions is $76.30 to $83.86, with sideways consolidation likely and a breakout above $84 or below $76 setting the next direction.
Upward momentum persists despite MA-200 cap and overbought signals
On the weekly (W1) chart, QNT maintains bullish momentum above the MA-20 and MA-50 but is capped by the MA-200, indicating sellers continue to exert downward pressure in the long-term. The nearest weekly support level is at the Ichimoku Kijun line around $80.19, while resistance is expected around the MA-50 and the round $82 mark. Weekly RSI and Stochastic RSI readings reflect bullish or overbought conditions, but the Commodity Channel Index is neutral, and ADX suggests the trend is ongoing but not especially strong. Bull/Bear Power shows buyer dominance, affirming current upward momentum.
Rangebound outlook expected as resistance caps near-term upside
For the next 5–7 trading days, QNT is expected to trade in a range between $76.30 and $83.86. The probability of sustained upside is limited to under 20%, with a sideways or mild pullback scenario being most likely as the price consolidates below the MA-200. Should a breakout above $84 occur, bullish momentum may strengthen; conversely, a drop below $76 would open room for further losses. The technical outlook leans toward consolidation with a cautious tone prevailing.
Previously it was reported that Quant (QNT) is showing short- and medium-term recovery as the price holds above the MA-20 and MA-50, though it remains below the MA-200, indicating an overall longer-term downtrend. Neutral readings from daily MACD, ADX, and oscillators, together with resistance at the MA-50 and $85, suggest consolidation within a volatile range, with no clear trend confirmation despite increased intraday buyer interest.


-
 Afghanistan
-
 Albania
-
 Algeria
-
 Angola
-
 Argentina
-
 Armenia
-
 Australia
-
 Austria
-
 Azerbaijan
-
 Bahamas
-
 Bahrain
-
 Bangladesh
-
 Belarus
-
 Belgium
-
 Bolivia
-
 Botswana
-
 Brazil
-
 Brunei
-
 Bulgaria
-
 Cambodia
-
 Cameroon
-
 Canada
-
 Chile
Chile
-
 China
China
-
 Colombia
-
 Congo
Congo
-
 Costa Rica
-
 Cote d'Ivoire
-
 Croatia
-
 Cuba
Cuba
-
 Cyprus
-
 Czechia
-
 DR Congo
-
 Denmark
-
 Dominican Republic
-
 Ecuador
-
 Egypt
Egypt
-
 El Salvador
-
 Estonia
-
 Eswatini
-
 Ethiopia
-
 Finland
-
 France
-
 Georgia
-
 Germany
-
 Ghana
Ghana
-
 Greece
-
 Haiti
Haiti
-
 Hong Kong
-
 Hungary
-
 India
India
-
 Indonesia
-
 Iran, Islamic republic
-
 Iraq
Iraq
-
 Ireland
-
 Israel
-
 Italy
Italy
-
 Jamaica
-
 Japan
Japan
-
 Jordan
-
 Kazakhstan
-
 Kenya
Kenya
-
 Korea
Korea
-
 Kuwait
-
 Kyrgyzstan
-
 Laos
Laos
-
 Latvia
-
 Lebanon
-
 Lesotho
-
 Libya
Libya
-
 Lithuania
-
 Luxembourg
-
 Madagascar
-
 Malaysia
-
 Malta
Malta
-
 Mauritius
-
 Mexico
-
 Moldova
-
 Mongolia
-
 Montenegro
-
 Morocco
-
 Mozambique
-
 Myanmar
-
 Namibia
-
 Nepal
Nepal
-
 Netherlands
-
 New Zealand
-
 Nigeria
-
 North Macedonia
-
 Norway
-
 Oman
Oman
-
 Pakistan
-
 Palestine
-
 Panama
-
 Papua New Guinea
-
 Paraguay
-
 Peru
Peru
-
 Philippines
-
 Poland
-
 Portugal
-
 Puerto Rico
-
 Qatar
Qatar
-
 Reunion
-
 Romania
-
 Rwanda
-
 Saudi Arabia
-
 Serbia
-
 Singapore
-
 Slovakia
-
 Slovenia
-
 Somalia
-
 South Africa
-
 Spain
Spain
-
 Sri Lanka
-
 Sweden
-
 Switzerland
-
 Syria
Syria
-
 Taiwan
-
 Tajikistan
-
 Tanzania
-
 Thailand
-
 Trinidad and Tobago
-
 Tunisia
-
 Turkey
-
 UAE
UAE
-
 Uganda
-
 Ukraine
-
 United Kingdom
-
United States
-
 Uruguay
-
 Uzbekistan
-
 Venezuela
-
 Vietnam
-
 Yemen
Yemen
-
 Zambia
-
 Zimbabwe
- Forex
- Crypto
