
-7.63% for Theta — momentum and volatility highlight downside risk

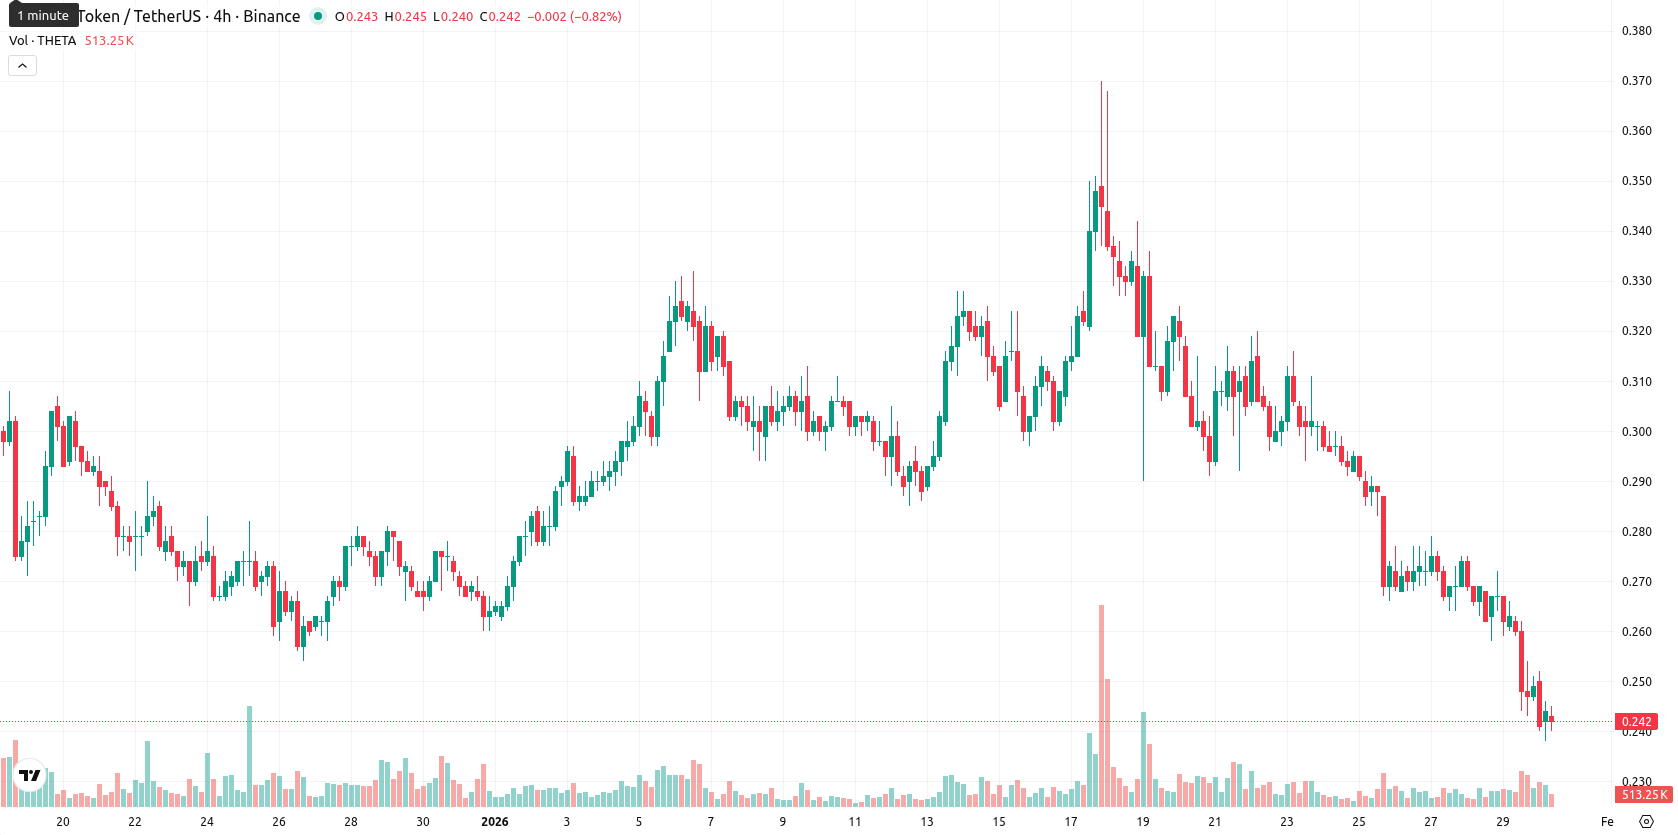
Theta (THETA) is trading well below all key Moving Averages, with the current price of $0.242 sitting beneath the MA-20 ($0.2977500), MA-50 ($0.2970200), and MA-200 ($0.5678500). This alignment signals heavy selling pressure across short, medium, and long-term trends, with the nearest dynamic resistance at the Ichimoku Kijun level around $0.3065000.
Highlights
- THETA trades at $0.242, significantly below its MA-20 ($0.29775), MA-50 ($0.29702), and MA-200 ($0.56785), signaling heavy multi-timeframe selling pressure.
- Momentum indicators—including ADX, MACD, RSI (34), Stochastic RSI, and CCI—confirm a strong bearish bias with persistent oversold conditions and negative Bull/Bear Power.
- For the next five sessions, THETA is expected to consolidate between $0.235 and $0.255, with over 80% probability of further decline unless $0.255 is broken to the upside.
Bearish momentum intensifies amid synchronized oversold signals
Momentum indicators confirm a prevailing bearish tone, as both ADX and MACD signal sustained downward momentum. RSI is in sell territory at 34, Stochastic RSI is deeply oversold, and CCI indicates an oversold condition, reflecting near-term exhaustion but no clear reversal. Bull/Bear Power is negative, confirming sellers’ dominance intraday, and the Awesome Oscillator also supports the broader downtrend. The current session shows a 7.63% decline, opening slightly below the prior close with no significant gap, and the price is trading near today’s low ($0.238), suggesting high volatility and persistent pressure after the open. Intraday moves and momentum indicators are aligned, both confirming the dominance of sellers and little sign of relief.
High downside probability as price trapped in tight range
For the next five sessions, THETA is expected to fluctuate between $0.235 and $0.255, a range adjusted for typical volatility relative to current levels. The probability of further decline is very high (more than 80%), while price recovery remains much less likely. In the baseline scenario, THETA consolidates sideways within this band. If bullish momentum unexpectedly returns and the price breaks above $0.255, a quick test of higher resistance at the Ichimoku Kijun may follow, while a drop below $0.235 could accelerate the bearish trend toward new lows.
Last time, analysts noted that Theta is firmly entrenched in a bearish trend as it trades well below major moving averages, with technical indicators such as the MACD, ADX, RSI, and CCI all underscoring strong oversold conditions and persistent seller dominance. Immediate resistance is identified at the Ichimoku Kijun level, with support near the recent low and price action is likely to remain rangebound, though a decisive move below support could trigger further downside risk.


-
 Afghanistan
-
 Albania
-
 Algeria
-
 Angola
-
 Argentina
-
 Armenia
-
 Australia
-
 Austria
-
 Azerbaijan
-
 Bahamas
-
 Bahrain
-
 Bangladesh
-
 Belarus
-
 Belgium
-
 Bolivia
-
 Botswana
-
 Brazil
-
 Brunei
-
 Bulgaria
-
 Cambodia
-
 Cameroon
-
 Canada
-
 Chile
Chile
-
 China
China
-
 Colombia
-
 Congo
Congo
-
 Costa Rica
-
 Cote d'Ivoire
-
 Croatia
-
 Cuba
Cuba
-
 Cyprus
-
 Czechia
-
 DR Congo
-
 Denmark
-
 Dominican Republic
-
 Ecuador
-
 Egypt
Egypt
-
 El Salvador
-
 Estonia
-
 Eswatini
-
 Ethiopia
-
 Finland
-
 France
-
 Georgia
-
 Germany
-
 Ghana
Ghana
-
 Greece
-
 Haiti
Haiti
-
 Hong Kong
-
 Hungary
-
 India
India
-
 Indonesia
-
 Iran, Islamic republic
-
 Iraq
Iraq
-
 Ireland
-
 Israel
-
 Italy
Italy
-
 Jamaica
-
 Japan
Japan
-
 Jordan
-
 Kazakhstan
-
 Kenya
Kenya
-
 Korea
Korea
-
 Kuwait
-
 Kyrgyzstan
-
 Laos
Laos
-
 Latvia
-
 Lebanon
-
 Lesotho
-
 Libya
Libya
-
 Lithuania
-
 Luxembourg
-
 Madagascar
-
 Malaysia
-
 Malta
Malta
-
 Mauritius
-
 Mexico
-
 Moldova
-
 Mongolia
-
 Montenegro
-
 Morocco
-
 Mozambique
-
 Myanmar
-
 Namibia
-
 Nepal
Nepal
-
 Netherlands
-
 New Zealand
-
 Nigeria
-
 North Macedonia
-
 Norway
-
 Oman
Oman
-
 Pakistan
-
 Palestine
-
 Panama
-
 Papua New Guinea
-
 Paraguay
-
 Peru
Peru
-
 Philippines
-
 Poland
-
 Portugal
-
 Puerto Rico
-
 Qatar
Qatar
-
 Reunion
-
 Romania
-
 Rwanda
-
 Saudi Arabia
-
 Serbia
-
 Singapore
-
 Slovakia
-
 Slovenia
-
 Somalia
-
 South Africa
-
 Spain
Spain
-
 Sri Lanka
-
 Sweden
-
 Switzerland
-
 Syria
Syria
-
 Taiwan
-
 Tajikistan
-
 Tanzania
-
 Thailand
-
 Trinidad and Tobago
-
 Tunisia
-
 Turkey
-
 UAE
UAE
-
 Uganda
-
 Ukraine
-
 United Kingdom
-
United States
-
 Uruguay
-
 Uzbekistan
-
 Venezuela
-
 Vietnam
-
 Yemen
Yemen
-
 Zambia
-
 Zimbabwe
- Forex
- Crypto
