
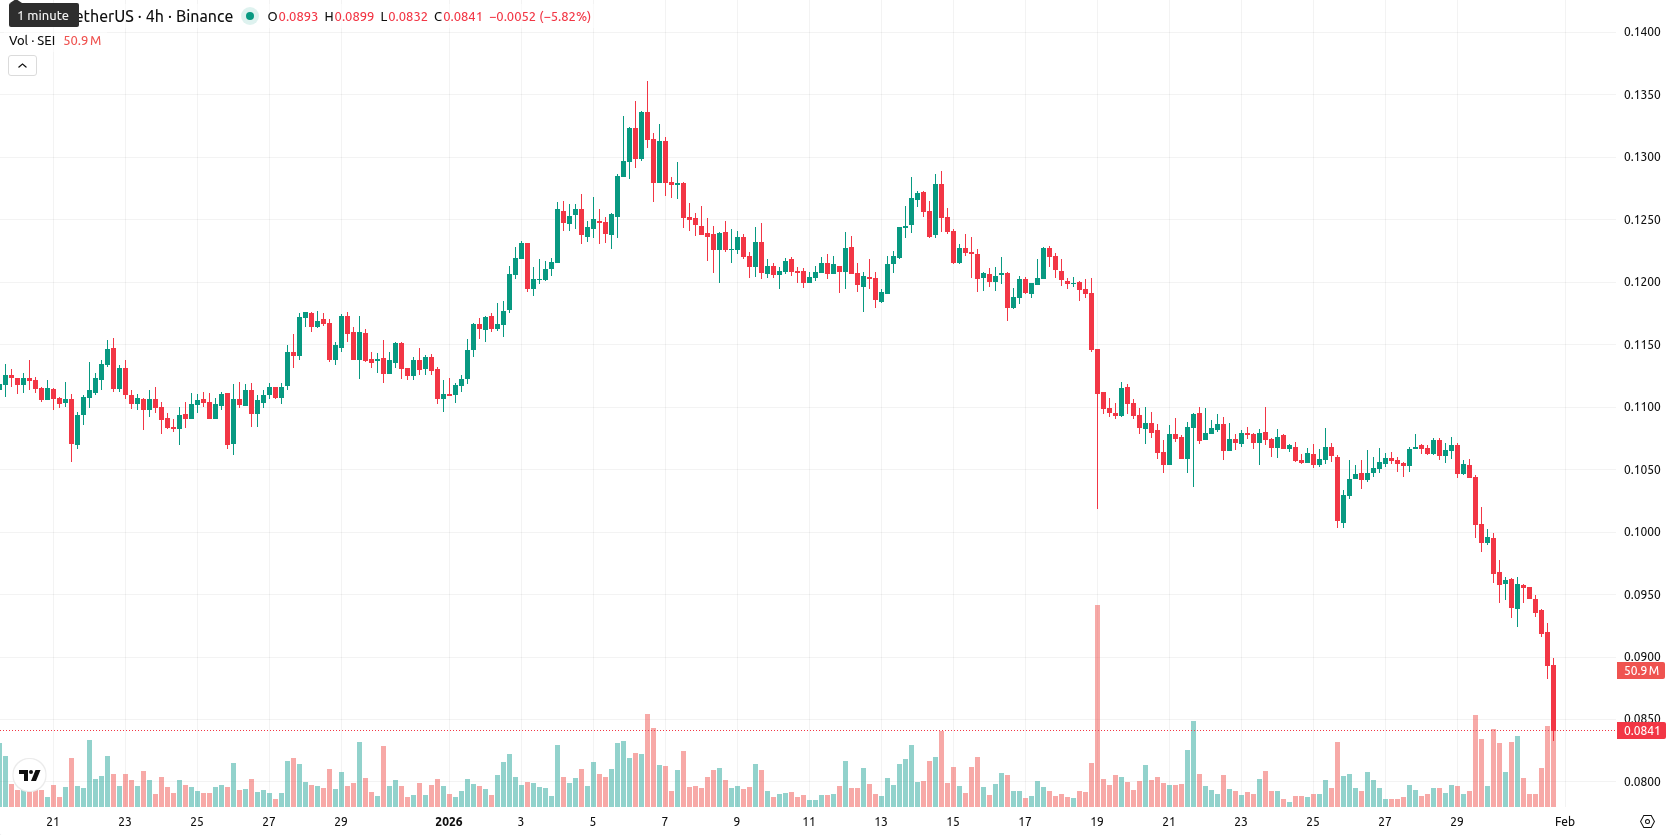
Technical breakdown accelerates selloff — Sei drops 9.63%

Sei (SEI) is trading well below the MA-20 at $0.1114, MA-50 at $0.1151, and MA-200 at $0.2169, reflecting substantial downside pressure across all principal timeframes. The latest daily movement highlights high volatility with a sharp loss, placing Sei near the bottom of today's range and far from any immediate dynamic supports.
Highlights
- SEI is trading well below its MA-20 ($0.1114), MA-50 ($0.1151), and MA-200 ($0.2169), confirming sustained downside pressure across all timeframes.
- Bearish momentum is reinforced by the negative MACD, ADX at 23.36 indicating a developing downtrend, and RSI at 28.78 revealing oversold conditions.
- For the next five trading days, SEI is expected to consolidate between $0.0800 and $0.0920 with over 80% probability of further decline.
Bearish momentum intensifies as technical supports erode
Current momentum indicators remain firmly bearish: the MACD confirms a negative trend, while the ADX at 23.36 indicates an emerging downtrend. RSI at 28.78 and Stochastic RSI at 0.00 both signal deep oversold conditions, further shown by the CCI at -137.8. Bull/Bear Power is negative, evidencing seller dominance, and the Awesome Oscillator supports a continued bearish direction. The Ichimoku Kijun dynamic resistance at $0.1144 is the closest notable level overhead, with no strong supports underneath.
Downside risk dominates while volatility confines price range
Over the next five trading days, Sei is likely to fluctuate within a price band of $0.0800 to $0.0920, consistent with typical volatility levels. The prevailing trend suggests more than an 80% probability of a further move lower, while a significant rally remains unlikely unless momentum shifts and a breakout above $0.0920 occurs. The baseline expectation is sideways consolidation in this volatility band, though a failure to rebound from oversold conditions could prompt a test below $0.0800.
Last time, analysts noted that Sei remains under persistent selling pressure, trading below all major moving averages, with momentum indicators such as MACD, ADX, RSI, and CCI highlighting a sustained downtrend and oversold conditions. Resistance aligns near the Ichimoku Kijun and $0.1050 while support is seen at $0.0930, suggesting further downside or consolidation in a tight range as sellers retain control.


-
 Afghanistan
-
 Albania
-
 Algeria
-
 Angola
-
 Argentina
-
 Armenia
-
 Australia
-
 Austria
-
 Azerbaijan
-
 Bahamas
-
 Bahrain
-
 Bangladesh
-
 Belarus
-
 Belgium
-
 Bolivia
-
 Botswana
-
 Brazil
-
 Brunei
-
 Bulgaria
-
 Cambodia
-
 Cameroon
-
 Canada
-
 Chile
Chile
-
 China
China
-
 Colombia
-
 Congo
Congo
-
 Costa Rica
-
 Cote d'Ivoire
-
 Croatia
-
 Cuba
Cuba
-
 Cyprus
-
 Czechia
-
 DR Congo
-
 Denmark
-
 Dominican Republic
-
 Ecuador
-
 Egypt
Egypt
-
 El Salvador
-
 Estonia
-
 Eswatini
-
 Ethiopia
-
 Finland
-
 France
-
 Georgia
-
 Germany
-
 Ghana
Ghana
-
 Greece
-
 Haiti
Haiti
-
 Hong Kong
-
 Hungary
-
 India
India
-
 Indonesia
-
 Iran, Islamic republic
-
 Iraq
Iraq
-
 Ireland
-
 Israel
-
 Italy
Italy
-
 Jamaica
-
 Japan
Japan
-
 Jordan
-
 Kazakhstan
-
 Kenya
Kenya
-
 Korea
Korea
-
 Kuwait
-
 Kyrgyzstan
-
 Laos
Laos
-
 Latvia
-
 Lebanon
-
 Lesotho
-
 Libya
Libya
-
 Lithuania
-
 Luxembourg
-
 Madagascar
-
 Malaysia
-
 Malta
Malta
-
 Mauritius
-
 Mexico
-
 Moldova
-
 Mongolia
-
 Montenegro
-
 Morocco
-
 Mozambique
-
 Myanmar
-
 Namibia
-
 Nepal
Nepal
-
 Netherlands
-
 New Zealand
-
 Nigeria
-
 North Macedonia
-
 Norway
-
 Oman
Oman
-
 Pakistan
-
 Palestine
-
 Panama
-
 Papua New Guinea
-
 Paraguay
-
 Peru
Peru
-
 Philippines
-
 Poland
-
 Portugal
-
 Puerto Rico
-
 Qatar
Qatar
-
 Reunion
-
 Romania
-
 Rwanda
-
 Saudi Arabia
-
 Serbia
-
 Singapore
-
 Slovakia
-
 Slovenia
-
 Somalia
-
 South Africa
-
 Spain
Spain
-
 Sri Lanka
-
 Sweden
-
 Switzerland
-
 Syria
Syria
-
 Taiwan
-
 Tajikistan
-
 Tanzania
-
 Thailand
-
 Trinidad and Tobago
-
 Tunisia
-
 Turkey
-
 UAE
UAE
-
 Uganda
-
 Ukraine
-
 United Kingdom
-
United States
-
 Uruguay
-
 Uzbekistan
-
 Venezuela
-
 Vietnam
-
 Yemen
Yemen
-
 Zambia
-
 Zimbabwe
- Forex
- Crypto
