
LINK weekly outlook: price drops below $10 with oversold indicators and sellers in control

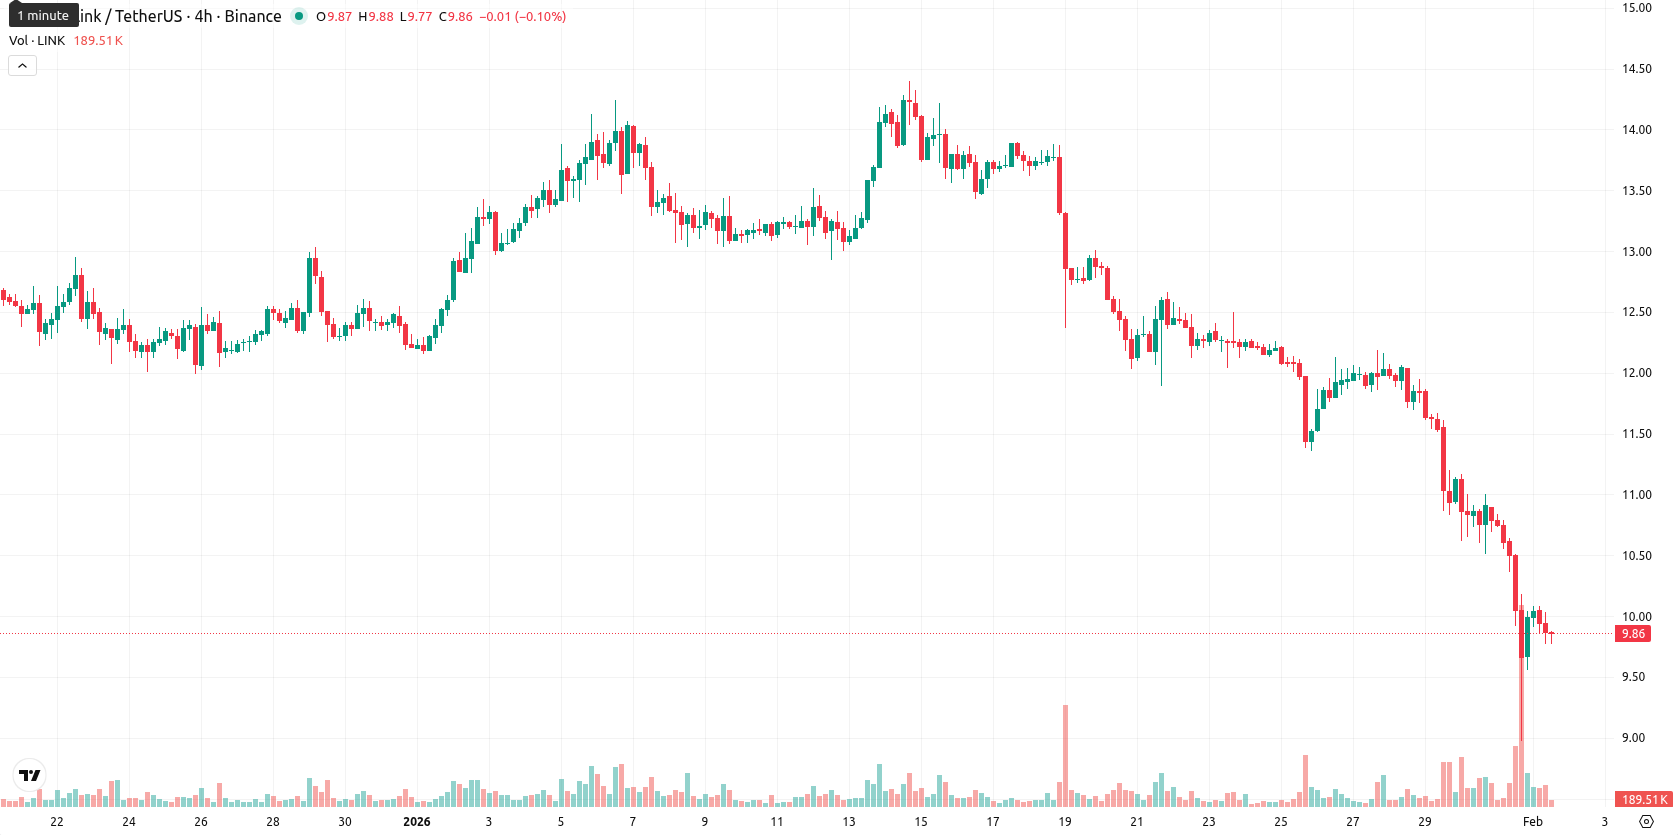
Chainlink (LINK) closed the week at $9.79, marking a drop of $0.67 or 6.37% over the past seven days. The price remains well below the W1 MA-20 ($12.46), MA-50 ($12.68), and MA-200 ($17.42), highlighting persistent bearish momentum across short-, medium-, and long-term timeframes.
Highlights
- Chainlink (LINK) is trading at $9.79, firmly below the MA-20 ($12.46), MA-50 ($12.68), and MA-200 ($17.42), confirming widespread bearish pressure.
- Momentum indicators such as MACD, ADX, and RSI (24.39) show a pronounced sell bias, with strong intraday selling and oversold conditions prevailing.
- Expected trading range for the next five days is $9.60–$10.60, with a bearish break below $9.60 likely to prompt accelerated selling.
Record reserve purchase drives tokenomics focus amid ecosystem buildup
On January 30, 2026, Chainlink executed its largest reserve purchase to date, adding 99,103.22 LINK tokens to its official holdings and bringing the reserve total to approximately 1,774,215.90 LINK, valued at over $19 million. The majority of this strategic accumulation was conducted via Uniswap, with the remainder sourced from direct fee revenue. This move is intended to strengthen tokenomics, support ecosystem development, and enhance validator incentives.
Persistent bearish momentum as major indicators enter oversold territory
Technical analysis on the weekly timeframe underlines a continued bearish trend. LINK trades well below all major W1 moving averages, with dynamic resistance found at the Ichimoku Kijun ($11.74) and no crossover signals between the MA-50 and MA-200. Momentum indicators paint a negative picture: the RSI is at a deeply oversold 24.39, the Stochastic RSI and CCI confirm oversold conditions, and the MACD, ADX, and Awesome Oscillator all indicate a steady downward trend, while Bull/Bear Power at –0.85 further reinforces seller dominance.
Rangebound outlook favored as bearish pressures limit rebound odds
For the upcoming week, sideways movement within a volatile $9.60 to $10.60 range is the baseline expectation. Ongoing bearish sentiment suggests a less than 20% chance of a significant rebound, with the path of least resistance skewed downward. A sustained move above $11.74 would be needed to shift the weekly outlook, but a weekly close below $9.60 could trigger further declines before any potential short-term bounce from oversold conditions.
Previously it was reported that Chainlink remains firmly below its short-, medium-, and long-term moving averages, with key technical indicators such as MACD, ADX, and RSI confirming strong bearish momentum and the asset trading in oversold territory. Despite some reserve growth and increased institutional interest, the price faces persistent selling pressure, with the nearest resistance unbroken and downside risks prevailing in the short term.


-
 Afghanistan
-
 Albania
-
 Algeria
-
 Angola
-
 Argentina
-
 Armenia
-
 Australia
-
 Austria
-
 Azerbaijan
-
 Bahamas
-
 Bahrain
-
 Bangladesh
-
 Belarus
-
 Belgium
-
 Bolivia
-
 Botswana
-
 Brazil
-
 Brunei
-
 Bulgaria
-
 Cambodia
-
 Cameroon
-
 Canada
-
 Chile
Chile
-
 China
China
-
 Colombia
-
 Congo
Congo
-
 Costa Rica
-
 Cote d'Ivoire
-
 Croatia
-
 Cuba
Cuba
-
 Cyprus
-
 Czechia
-
 DR Congo
-
 Denmark
-
 Dominican Republic
-
 Ecuador
-
 Egypt
Egypt
-
 El Salvador
-
 Estonia
-
 Eswatini
-
 Ethiopia
-
 Finland
-
 France
-
 Georgia
-
 Germany
-
 Ghana
Ghana
-
 Greece
-
 Haiti
Haiti
-
 Hong Kong
-
 Hungary
-
 India
India
-
 Indonesia
-
 Iran, Islamic republic
-
 Iraq
Iraq
-
 Ireland
-
 Israel
-
 Italy
Italy
-
 Jamaica
-
 Japan
Japan
-
 Jordan
-
 Kazakhstan
-
 Kenya
Kenya
-
 Korea
Korea
-
 Kuwait
-
 Kyrgyzstan
-
 Laos
Laos
-
 Latvia
-
 Lebanon
-
 Lesotho
-
 Libya
Libya
-
 Lithuania
-
 Luxembourg
-
 Madagascar
-
 Malaysia
-
 Malta
Malta
-
 Mauritius
-
 Mexico
-
 Moldova
-
 Mongolia
-
 Montenegro
-
 Morocco
-
 Mozambique
-
 Myanmar
-
 Namibia
-
 Nepal
Nepal
-
 Netherlands
-
 New Zealand
-
 Nigeria
-
 North Macedonia
-
 Norway
-
 Oman
Oman
-
 Pakistan
-
 Palestine
-
 Panama
-
 Papua New Guinea
-
 Paraguay
-
 Peru
Peru
-
 Philippines
-
 Poland
-
 Portugal
-
 Puerto Rico
-
 Qatar
Qatar
-
 Reunion
-
 Romania
-
 Rwanda
-
 Saudi Arabia
-
 Serbia
-
 Singapore
-
 Slovakia
-
 Slovenia
-
 Somalia
-
 South Africa
-
 Spain
Spain
-
 Sri Lanka
-
 Sweden
-
 Switzerland
-
 Syria
Syria
-
 Taiwan
-
 Tajikistan
-
 Tanzania
-
 Thailand
-
 Trinidad and Tobago
-
 Tunisia
-
 Turkey
-
 UAE
UAE
-
 Uganda
-
 Ukraine
-
 United Kingdom
-
United States
-
 Uruguay
-
 Uzbekistan
-
 Venezuela
-
 Vietnam
-
 Yemen
Yemen
-
 Zambia
-
 Zimbabwe
- Forex
- Crypto
