
Chainlink price prediction: Will support at $9.70 hold as LINK faces heavy selling?

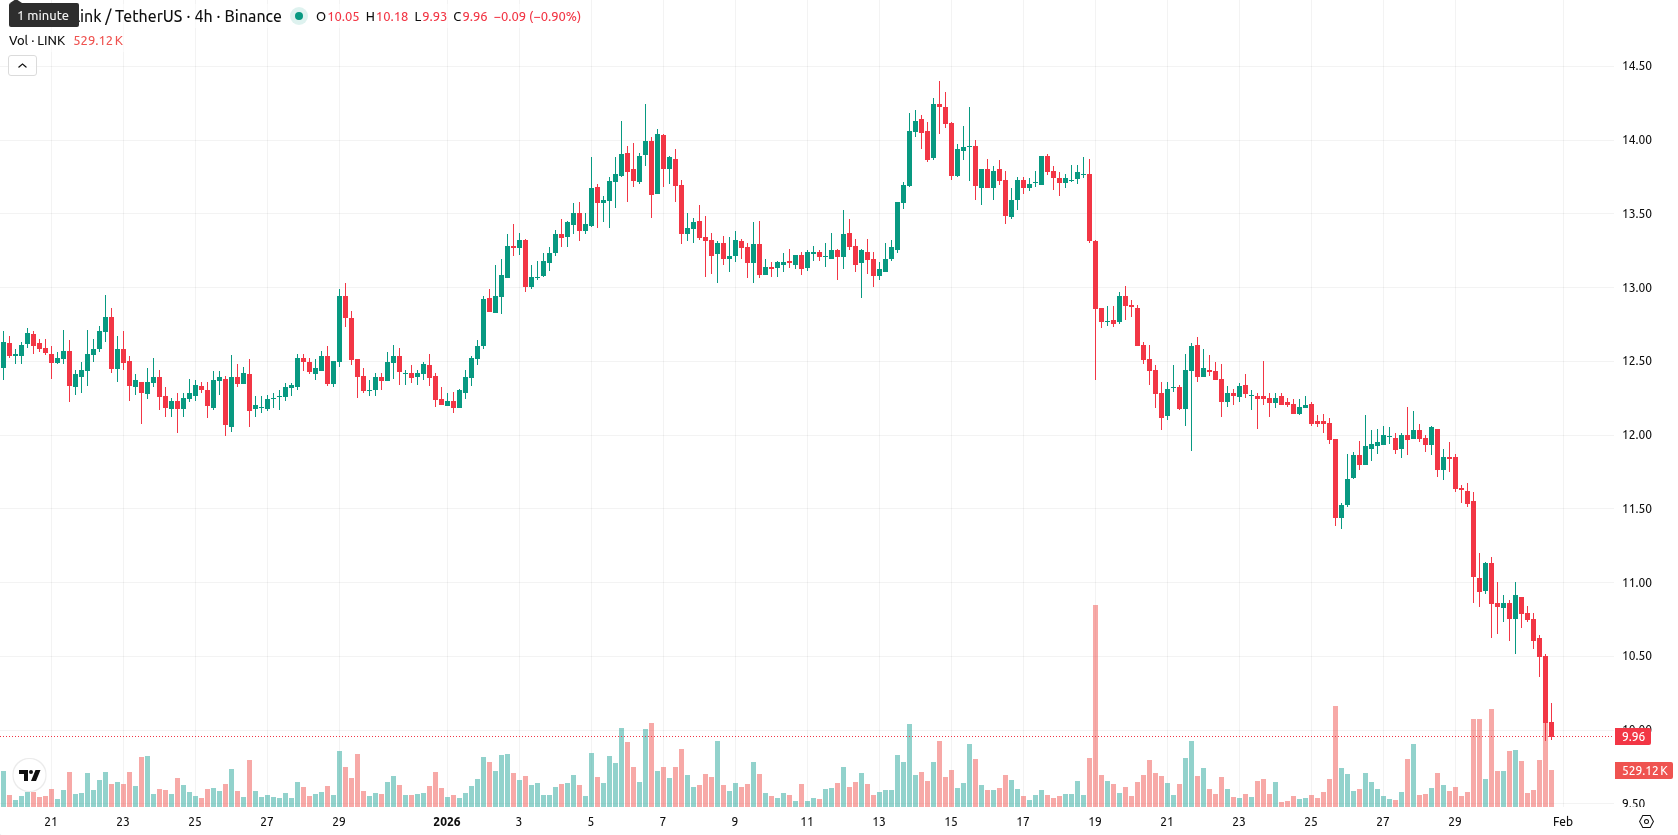
Chainlink (LINK) is trading at $10.03, staying well below the MA-20 ($12.62), MA-50 ($12.75), and MA-200 ($17.45). This positioning indicates persistent selling pressure across short-, medium-, and long-term trends, while the nearest dynamic resistance is set by the Ichimoku Kijun at $12.46.
Highlights
- Chainlink's official reserve grew by 99,103 LINK on January 29, 2025, marking the largest purchase since late 2025 and raising reserves to 1.77 million LINK.
- Reserve expansion is driven by revenue from on-chain services and institutional off-chain payments, reflecting ongoing network adoption and growing interest from both institutional and retail segments.
- LINK trades at $10.03—well below MA-20, MA-50, and MA-200—with negative technical momentum and a high likelihood (>80%) of further decline toward the $9.70–$10.80 range.
Reserve growth and whale accumulation as institutional adoption accelerates
Chainlink’s official reserve recently increased with the addition of 99,103 LINK on January 29, 2025, the largest single purchase since late 2025, boosting the reserve to about 1.77 million LINK. This expansion is credited to revenue from on-chain service usage and institutional off-chain payments, highlighting sustained network adoption. There is further evidence of increased whale accumulation and ongoing institutional as well as retail interest, supported by steady fee revenue and broader accessibility through CME futures and leading investment products.
Bearish momentum and oversold exhaustion as downside persists
Daily momentum readings are negative, with MACD and ADX both forecasting a sell, confirming a loss of upside strength. Multiple oscillators — RSI (29.18), Stochastic RSI, and CCI — are in oversold territory, highlighting exhaustion on the downside, yet Bull/Bear Power shows sellers remain clearly dominant. The Awesome Oscillator also supports the bearish trend. Today’s session sees LINK down 7.47%, with no material gap between the previous close ($10.84) and today's open ($10.78). The price is currently near today’s low of $9.93, reflecting high intraday volatility and aggressive pressure after the open, aligning with the broader bear momentum.
Downside risk elevated as oversold signals slow further decline
For the next week, a typical volatility band is anticipated between $9.70 and $10.80. The probability of a further price decrease is very high (more than 80%), while an upward move is much less likely. The baseline scenario suggests sideways movement within the range, as oversold readings may slow further declines. A bullish scenario would require a breakout above $10.80, potentially targeting $12.00 resistance, while a bearish scenario could unfold if $9.70 is breached, setting up new multi-month lows. Overall, technicals favor a cautious stance with bears controlling the short-term outlook.
Last time, analysts noted that Chainlink is currently trading well below its key moving averages, with momentum and volatility indicators such as the MACD, ADX, and RSI all signaling intensified bearish pressure. The nearest resistance at the Ichimoku Kijun level remains unbroken, and downside risks are elevated, with the asset expected to remain range-bound amid persistent seller dominance.


Latest Chainlink News


-
 Afghanistan
-
 Albania
-
 Algeria
-
 Angola
-
 Argentina
-
 Armenia
-
 Australia
-
 Austria
-
 Azerbaijan
-
 Bahamas
-
 Bahrain
-
 Bangladesh
-
 Belarus
-
 Belgium
-
 Bolivia
-
 Botswana
-
 Brazil
-
 Brunei
-
 Bulgaria
-
 Cambodia
-
 Cameroon
-
 Canada
-
 Chile
Chile
-
 China
China
-
 Colombia
-
 Congo
Congo
-
 Costa Rica
-
 Cote d'Ivoire
-
 Croatia
-
 Cuba
Cuba
-
 Cyprus
-
 Czechia
-
 DR Congo
-
 Denmark
-
 Dominican Republic
-
 Ecuador
-
 Egypt
Egypt
-
 El Salvador
-
 Estonia
-
 Eswatini
-
 Ethiopia
-
 Finland
-
 France
-
 Georgia
-
 Germany
-
 Ghana
Ghana
-
 Greece
-
 Haiti
Haiti
-
 Hong Kong
-
 Hungary
-
 India
India
-
 Indonesia
-
 Iran, Islamic republic
-
 Iraq
Iraq
-
 Ireland
-
 Israel
-
 Italy
Italy
-
 Jamaica
-
 Japan
Japan
-
 Jordan
-
 Kazakhstan
-
 Kenya
Kenya
-
 Korea
Korea
-
 Kuwait
-
 Kyrgyzstan
-
 Laos
Laos
-
 Latvia
-
 Lebanon
-
 Lesotho
-
 Libya
Libya
-
 Lithuania
-
 Luxembourg
-
 Madagascar
-
 Malaysia
-
 Malta
Malta
-
 Mauritius
-
 Mexico
-
 Moldova
-
 Mongolia
-
 Montenegro
-
 Morocco
-
 Mozambique
-
 Myanmar
-
 Namibia
-
 Nepal
Nepal
-
 Netherlands
-
 New Zealand
-
 Nigeria
-
 North Macedonia
-
 Norway
-
 Oman
Oman
-
 Pakistan
-
 Palestine
-
 Panama
-
 Papua New Guinea
-
 Paraguay
-
 Peru
Peru
-
 Philippines
-
 Poland
-
 Portugal
-
 Puerto Rico
-
 Qatar
Qatar
-
 Reunion
-
 Romania
-
 Rwanda
-
 Saudi Arabia
-
 Serbia
-
 Singapore
-
 Slovakia
-
 Slovenia
-
 Somalia
-
 South Africa
-
 Spain
Spain
-
 Sri Lanka
-
 Sweden
-
 Switzerland
-
 Syria
Syria
-
 Taiwan
-
 Tajikistan
-
 Tanzania
-
 Thailand
-
 Trinidad and Tobago
-
 Tunisia
-
 Turkey
-
 UAE
UAE
-
 Uganda
-
 Ukraine
-
 United Kingdom
-
United States
-
 Uruguay
-
 Uzbekistan
-
 Venezuela
-
 Vietnam
-
 Yemen
Yemen
-
 Zambia
-
 Zimbabwe
- Forex
- Crypto
