
Chainlink price prediction: Bearish trend to continue as LINK trades near support

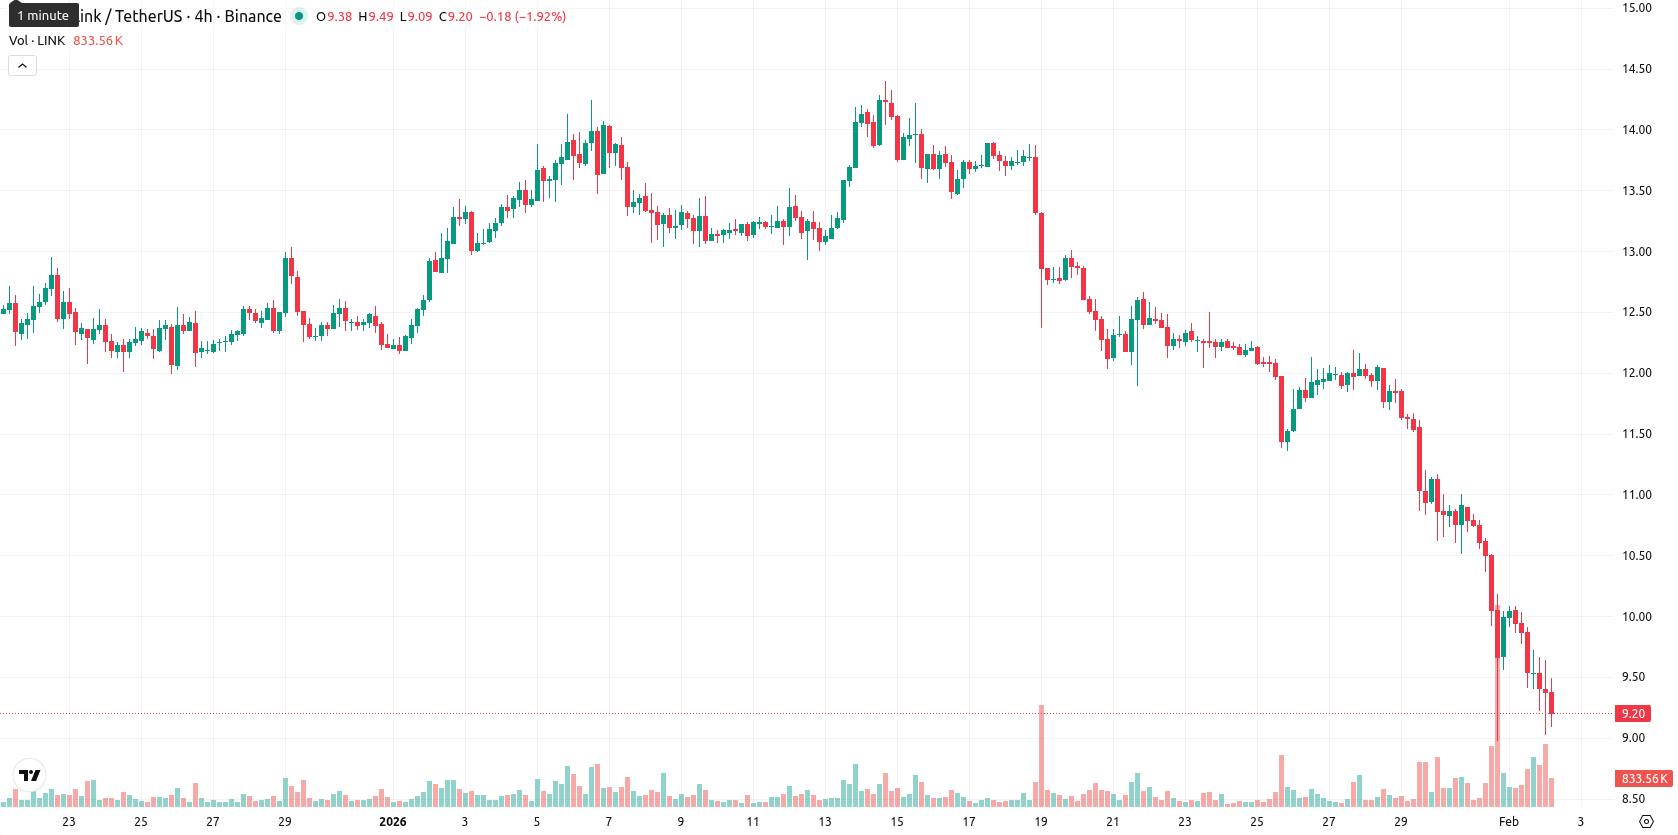
Chainlink (LINK) is currently trading at $9.20, which is well below the Moving Average-20 ($12.27), Moving Average-50 ($12.59), and Moving Average-200 ($17.39), signaling decisive pressure from sellers and confirming a bearish structure across short-, medium-, and long-term timeframes.
Highlights
- Chainlink is seeing increased institutional adoption, with the U.S. Department of Commerce using Chainlink Data Feeds to publish macroeconomic data on-chain.
- UBS completed the first live tokenized fund workflow using Chainlink’s Digital Transfer Agent standard, advancing traditional financial integration and asset management capabilities.
- Chainlink (LINK) trades at $9.20, decisively below all key moving averages, with strong negative momentum, oversold technicals, and near-term support at $9.02 amid prevailing bearish pressure.
Institutional adoption accelerates amid high-profile partnerships
Chainlink continues to see significant institutional adoption, with the U.S. Department of Commerce leveraging Chainlink Data Feeds to publish macroeconomic data on-chain. UBS has successfully completed the first live, end-to-end tokenized fund workflow utilizing Chainlink’s Digital Transfer Agent standard, strengthening its credentials for institutional-grade asset management and integration into traditional financial infrastructure. Other developments include Chainlink’s partnerships with Mastercard, integration with the Canton Network, and involvement in setting technical standards for stablecoins through the Global Alliance for Korean Won Stablecoin.
Oversold momentum intensifies as sellers test near-term support
The nearest dynamic resistance is indicated by the Ichimoku Kijun at $11.69, while short-term support is found at today’s low near $9.02; there is no golden or death cross present. Momentum remains firmly negative as both the MACD and ADX signal a strong sell bias, with the MACD showing clear downward momentum and the ADX confirming trend strength. Oversold conditions are prominent according to the RSI (21.61), Stochastic RSI (0.00), and CCI (–191.88), with the Bull/Bear Power indicator at –1.29 suggesting dominant seller control during the session. The Awesome Oscillator also aligns with the bearish trend, supporting continued downside.
Further downside likely as breakout prospects remain weak
For the next five trading days, LINK is expected to trade within a typical volatility band between $9.00 and $10.20, based on current conditions. The probability of a price increase is very low (less than 20%), making further downside more likely. The baseline scenario anticipates price action consolidating sideways around current levels. A sustained move above dynamic resistance at $11.69 would be required for a bullish reversal but appears unlikely, while continued selling pressure could see LINK drop below $9.00 in the short term.
Last time, analysts noted that Chainlink continues to trade well below key moving averages, with persistent bearish momentum confirmed by deeply oversold RSI and negative MACD signals. Support is seen around $9.60, resistance near $11.74, and the asset is expected to remain rangebound amid prevailing seller dominance.


-
 Afghanistan
-
 Albania
-
 Algeria
-
 Angola
-
 Argentina
-
 Armenia
-
 Australia
-
 Austria
-
 Azerbaijan
-
 Bahamas
-
 Bahrain
-
 Bangladesh
-
 Belarus
-
 Belgium
-
 Bolivia
-
 Botswana
-
 Brazil
-
 Brunei
-
 Bulgaria
-
 Cambodia
-
 Cameroon
-
 Canada
-
 Chile
Chile
-
 China
China
-
 Colombia
-
 Congo
Congo
-
 Costa Rica
-
 Cote d'Ivoire
-
 Croatia
-
 Cuba
Cuba
-
 Cyprus
-
 Czechia
-
 DR Congo
-
 Denmark
-
 Dominican Republic
-
 Ecuador
-
 Egypt
Egypt
-
 El Salvador
-
 Estonia
-
 Eswatini
-
 Ethiopia
-
 Finland
-
 France
-
 Georgia
-
 Germany
-
 Ghana
Ghana
-
 Greece
-
 Haiti
Haiti
-
 Hong Kong
-
 Hungary
-
 India
India
-
 Indonesia
-
 Iran, Islamic republic
-
 Iraq
Iraq
-
 Ireland
-
 Israel
-
 Italy
Italy
-
 Jamaica
-
 Japan
Japan
-
 Jordan
-
 Kazakhstan
-
 Kenya
Kenya
-
 Korea
Korea
-
 Kuwait
-
 Kyrgyzstan
-
 Laos
Laos
-
 Latvia
-
 Lebanon
-
 Lesotho
-
 Libya
Libya
-
 Lithuania
-
 Luxembourg
-
 Madagascar
-
 Malaysia
-
 Malta
Malta
-
 Mauritius
-
 Mexico
-
 Moldova
-
 Mongolia
-
 Montenegro
-
 Morocco
-
 Mozambique
-
 Myanmar
-
 Namibia
-
 Nepal
Nepal
-
 Netherlands
-
 New Zealand
-
 Nigeria
-
 North Macedonia
-
 Norway
-
 Oman
Oman
-
 Pakistan
-
 Palestine
-
 Panama
-
 Papua New Guinea
-
 Paraguay
-
 Peru
Peru
-
 Philippines
-
 Poland
-
 Portugal
-
 Puerto Rico
-
 Qatar
Qatar
-
 Reunion
-
 Romania
-
 Rwanda
-
 Saudi Arabia
-
 Serbia
-
 Singapore
-
 Slovakia
-
 Slovenia
-
 Somalia
-
 South Africa
-
 Spain
Spain
-
 Sri Lanka
-
 Sweden
-
 Switzerland
-
 Syria
Syria
-
 Taiwan
-
 Tajikistan
-
 Tanzania
-
 Thailand
-
 Trinidad and Tobago
-
 Tunisia
-
 Turkey
-
 UAE
UAE
-
 Uganda
-
 Ukraine
-
 United Kingdom
-
United States
-
 Uruguay
-
 Uzbekistan
-
 Venezuela
-
 Vietnam
-
 Yemen
Yemen
-
 Zambia
-
 Zimbabwe
- Forex
- Crypto
