

QNT weekly forecast: Stays below key moving averages — sellers keep control

Quant (QNT) is currently trading at $67.52, marking a weekly decline and positioning it distinctly below its MA-20 ($75.86), MA-50 ($75.31), and MA-200 ($91.33) levels. This shows that QNT remains under sustained selling pressure on the weekly chart and is trading beneath all major weekly moving averages.
QNT price prediction
Current price:
$198.37
2.26
1.15%
Real-time Data
06:22
Daily range
194.64
 198.43
Weekly range
185.350000
210.980000
210.980000
Loading...
Highlights
- QNT trades at $67.52, beneath the MA-20 ($75.86), MA-50 ($75.31), and MA-200 ($91.33), confirming sustained multi-timeframe bearish pressure.
- Momentum remains negative as MACD and ADX signal weakness, while RSI (37.84) and CCI (-144.63) indicate oversold conditions amid persistent selling.
- Near-term range is expected between $65.50 and $74.00; a break above $75.89 resistance implies upside, while a move below $65.50 risks additional declines.
Bearish momentum deepens as weekly indicators turn oversold
Weekly technical analysis confirms a bearish setup for QNT, with negative momentum indicated by both the MACD and ADX. The Ichimoku Kijun line at $75.89 acts as the closest dynamic resistance, while no weekly moving average support is available below. Leading oscillators, including a weekly RSI of 37.84 and deeply oversold readings from the Stochastic RSI and CCI (-144.63), suggest the asset is technically oversold, yet sellers remain in control as reflected by strongly negative Bull/Bear Power.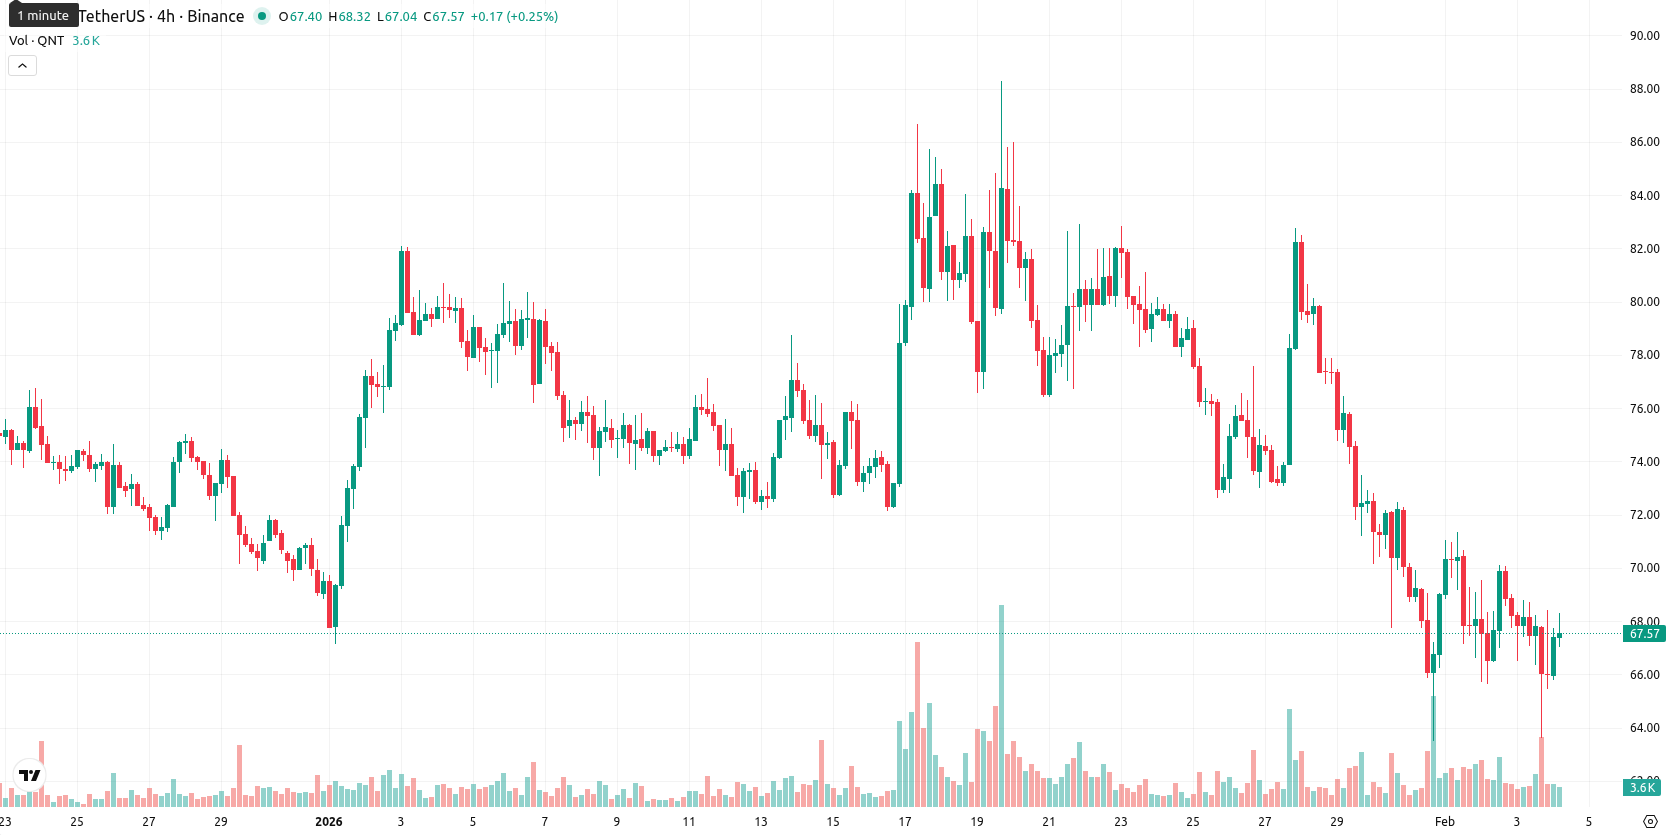
Volatility persists this week with risk skewed to further downside
Over the next 5–7 trading days, QNT is expected to fluctuate within a range of $65.50 to $74.00, reflecting ongoing volatility and bearish sentiment. A sustained move above resistance at $75.89 could open the path toward the upper end near $74.00, but short-term rallies may be capped by momentum weakness. The bearish scenario remains dominant unless QNT can break and hold above key resistance, while a drop below $65.50 could lead to accelerated declines.
Sholanke Dele, market strategist, sees little relief for QNT after a week of continued downside below all major weekly moving averages. He believes technical sentiment remains negative, with oversold readings showing a lack of buyer conviction. Macro flows offer no tailwinds, reinforcing the dominant bearish pressure. "Unless QNT reclaims $75.89, I remain defensive and expect more weakness this week."
Last time, analysts noted that Quant is exhibiting pronounced bearish momentum, trading firmly below its short-, medium-, and long-term moving averages, with technical indicators such as RSI, MACD, and oscillators confirming weak momentum and extended oversold conditions. Key resistance remains overhead while support is sparse, suggesting a sideways to lower bias unless a decisive breakout above resistance levels occurs.
Source of Data:
QNT Price Analysis by TU
The analysis is based on a proprietary model combining technical, on-chain, and expert data. Not investment advice. See
methodology
This material may contain third-party opinions, none of the data and information on this webpage constitutes investment advice according to our Disclaimer. While we adhere to strict Editorial Integrity, this post may contain references to products from our partners.
Subscribe to TU news


Did you like the article?






Top News


Top 5 companies for you

United States
-
 Afghanistan
-
 Albania
-
 Algeria
-
 Angola
-
 Argentina
-
 Armenia
-
 Australia
-
 Austria
-
 Azerbaijan
-
 Bahamas
-
 Bahrain
-
 Bangladesh
-
 Belarus
-
 Belgium
-
 Bolivia
-
 Botswana
-
 Brazil
-
 Brunei
-
 Bulgaria
-
 Cambodia
-
 Cameroon
-
 Canada
-
 Chile
-
 China
-
 Colombia
-
 Congo
-
 Costa Rica
-
 Cote d'Ivoire
-
 Croatia
-
 Cuba
-
 Cyprus
-
 Czechia
-
 DR Congo
-
 Denmark
-
 Dominican Republic
-
 Ecuador
-
 Egypt
-
 El Salvador
-
 Estonia
-
 Eswatini
-
 Ethiopia
-
 Finland
-
 France
-
 Georgia
-
 Germany
-
 Ghana
-
 Greece
-
 Haiti
-
 Hong Kong
-
 Hungary
-
 India
-
 Indonesia
-
 Iran, Islamic republic
-
 Iraq
-
 Ireland
-
 Israel
-
 Italy
-
 Jamaica
-
 Japan
-
 Jordan
-
 Kazakhstan
-
 Kenya
-
 Korea
-
 Kuwait
-
 Kyrgyzstan
-
 Laos
-
 Latvia
-
 Lebanon
-
 Lesotho
-
 Libya
-
 Lithuania
-
 Luxembourg
-
 Madagascar
-
 Malaysia
-
 Malta
-
 Mauritius
-
 Mexico
-
 Moldova
-
 Mongolia
-
 Montenegro
-
 Morocco
-
 Mozambique
-
 Myanmar
-
 Namibia
-
 Nepal
-
 Netherlands
-
 New Zealand
-
 Nigeria
-
 North Macedonia
-
 Norway
-
 Oman
-
 Pakistan
-
 Palestine
-
 Panama
-
 Papua New Guinea
-
 Paraguay
-
 Peru
-
 Philippines
-
 Poland
-
 Portugal
-
 Puerto Rico
-
 Qatar
-
 Reunion
-
 Romania
-
 Rwanda
-
 Saudi Arabia
-
 Serbia
-
 Singapore
-
 Slovakia
-
 Slovenia
-
 Somalia
-
 South Africa
-
 Spain
-
 Sri Lanka
-
 Sweden
-
 Switzerland
-
 Syria
-
 Taiwan
-
 Tajikistan
-
 Tanzania
-
 Thailand
-
 Trinidad and Tobago
-
 Tunisia
-
 Turkey
-
 UAE
-
 Uganda
-
 Ukraine
-
 United Kingdom
-
United States
-
 Uruguay
-
 Uzbekistan
-
 Venezuela
-
 Vietnam
-
 Yemen
-
 Zambia
-
 Zimbabwe
- Forex
- Crypto










Live News


