
-7.72% for Maple — bears dominate amid oversold signals and weak trend

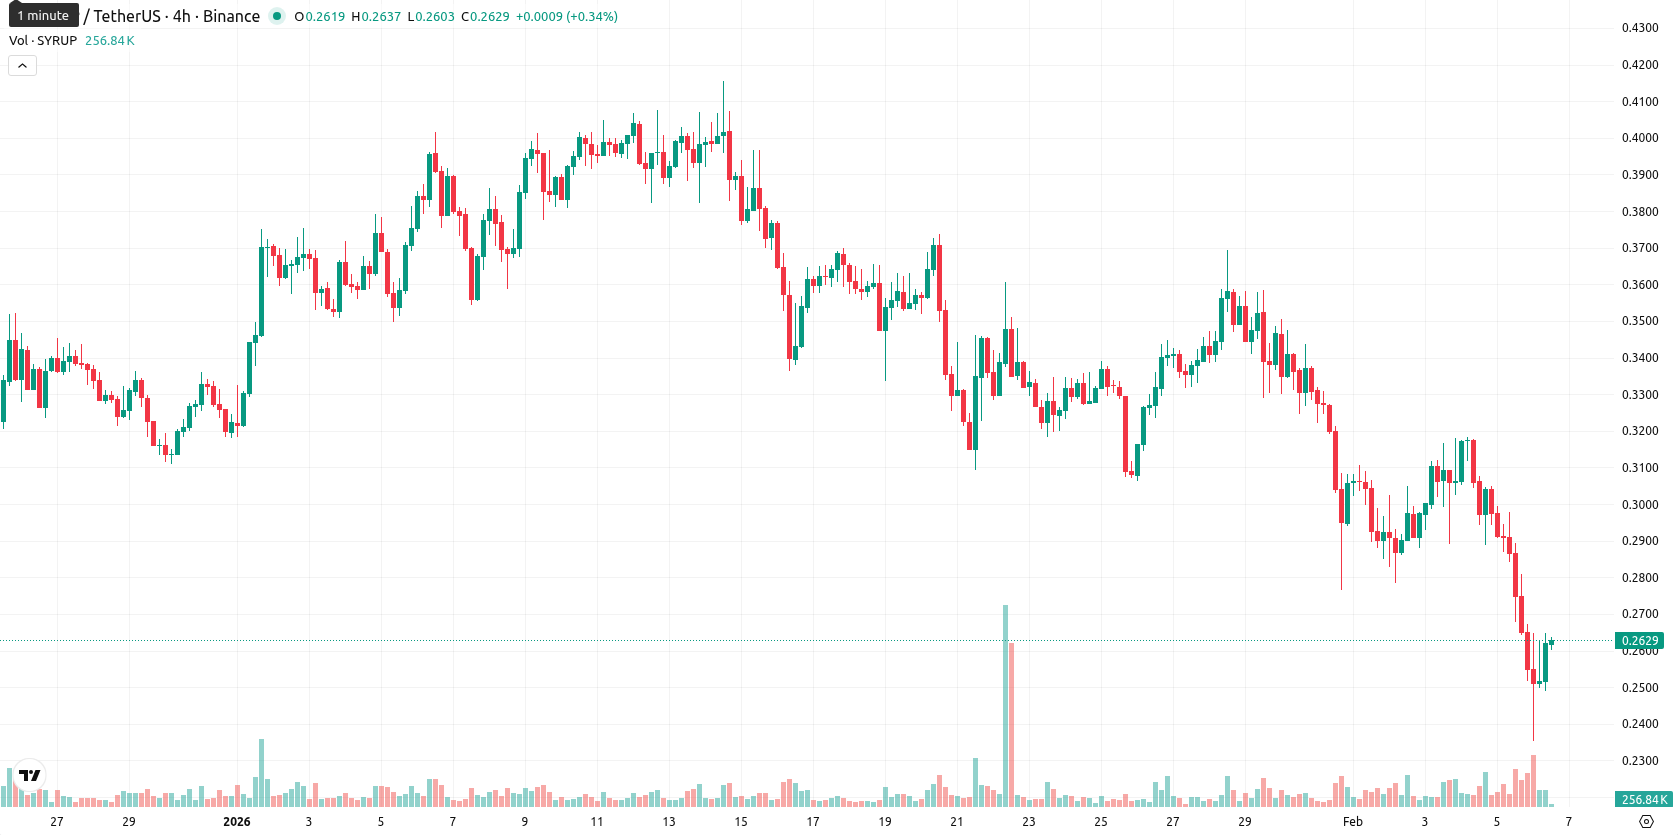
Maple (SYRUP) is trading at $0.2619, which is well below its MA-20 ($0.3255), MA-50 ($0.3427), and MA-200 ($0.3878), indicating firm short-, medium-, and long-term bearish trends with sellers maintaining control.
Highlights
- SYRUP trades decisively below its MA-20 ($0.3255), MA-50 ($0.3427), and MA-200 ($0.3878), confirming persistent bearish momentum across all key timeframes.
- Momentum and trend indicators, including MACD, low ADX, and Awesome Oscillator, all reinforce a sell bias, with sellers dominating and oversold signals present on RSI and CCI.
- For the coming week, SYRUP is expected to consolidate between $0.235 and $0.285, with less than a 20% probability of a price increase and downside risk prevailing unless $0.285 resistance is overcome.
Oversold technicals persist amid weak trend and high volatility
The nearest dynamic resistance is identified at the Ichimoku Kijun level of $0.3336, while there is no clear dynamic support indicated in current data. Momentum remains negative as the MACD generates a Sell signal, supported by a low ADX value that suggests a weak trend. Oversold signals are evident from the Relative Strength Index (RSI), Stochastic RSI, and Commodity Channel Index (CCI), while Bull/Bear Power also points to seller dominance. The Awesome Oscillator also supports the downward trend on the daily chart. The current session shows a price decline of 7.72% to $0.2619, opening without a gap and now hovering near the upper boundary of today's range ($0.2352 — $0.2648), reflecting high intraday volatility and persistent selling pressure after the open. While oscillators suggest the market is oversold and some momentum indicators are weak, downward intraday movement remains confirmed by the overall negative tone.
Further downside favored as consolidation and low rally odds dominate
For the coming week, a price corridor for SYRUP is expected in the range of $0.235 — $0.285, staying within a typical volatility band relative to current levels due to recent swings. The probability of a price increase is very low (less than 20%), while further declines remain much more likely given the consistent Sell signals from weekly RSI, MACD, and the absence of upside signals. The baseline scenario suggests consolidation in a sideways corridor within this range, while a bullish breakout would require the price to sustain above $0.285 and overcome resistance near the Ichimoku Kijun. A bearish scenario would see the price falling below $0.235, with further oversold momentum potentially accelerating declines before any relief rally emerges.
Previously it was reported that Maple Finance (SYRUP) continues to exhibit a pronounced bearish trend, with the price trading well below key moving averages and facing persistent downside momentum confirmed by MACD, ADX, and deeply oversold levels on RSI and other oscillators. Immediate resistance is noted at the Ichimoku Kijun level near $0.3336, while elevated intraday volatility and ongoing selling pressure point to ongoing downside risk with no imminent signs of recovery.


Latest Maple News


-
 Afghanistan
-
 Albania
-
 Algeria
-
 Angola
-
 Argentina
-
 Armenia
-
 Australia
-
 Austria
-
 Azerbaijan
-
 Bahamas
-
 Bahrain
-
 Bangladesh
-
 Belarus
-
 Belgium
-
 Bolivia
-
 Botswana
-
 Brazil
-
 Brunei
-
 Bulgaria
-
 Cambodia
-
 Cameroon
-
 Canada
-
 Chile
Chile
-
 China
China
-
 Colombia
-
 Congo
Congo
-
 Costa Rica
-
 Cote d'Ivoire
-
 Croatia
-
 Cuba
Cuba
-
 Cyprus
-
 Czechia
-
 DR Congo
-
 Denmark
-
 Dominican Republic
-
 Ecuador
-
 Egypt
Egypt
-
 El Salvador
-
 Estonia
-
 Eswatini
-
 Ethiopia
-
 Finland
-
 France
-
 Georgia
-
 Germany
-
 Ghana
Ghana
-
 Greece
-
 Haiti
Haiti
-
 Hong Kong
-
 Hungary
-
 India
India
-
 Indonesia
-
 Iran, Islamic republic
-
 Iraq
Iraq
-
 Ireland
-
 Israel
-
 Italy
Italy
-
 Jamaica
-
 Japan
Japan
-
 Jordan
-
 Kazakhstan
-
 Kenya
Kenya
-
 Korea
Korea
-
 Kuwait
-
 Kyrgyzstan
-
 Laos
Laos
-
 Latvia
-
 Lebanon
-
 Lesotho
-
 Libya
Libya
-
 Lithuania
-
 Luxembourg
-
 Madagascar
-
 Malaysia
-
 Malta
Malta
-
 Mauritius
-
 Mexico
-
 Moldova
-
 Mongolia
-
 Montenegro
-
 Morocco
-
 Mozambique
-
 Myanmar
-
 Namibia
-
 Nepal
Nepal
-
 Netherlands
-
 New Zealand
-
 Nigeria
-
 North Macedonia
-
 Norway
-
 Oman
Oman
-
 Pakistan
-
 Palestine
-
 Panama
-
 Papua New Guinea
-
 Paraguay
-
 Peru
Peru
-
 Philippines
-
 Poland
-
 Portugal
-
 Puerto Rico
-
 Qatar
Qatar
-
 Reunion
-
 Romania
-
 Rwanda
-
 Saudi Arabia
-
 Serbia
-
 Singapore
-
 Slovakia
-
 Slovenia
-
 Somalia
-
 South Africa
-
 Spain
Spain
-
 Sri Lanka
-
 Sweden
-
 Switzerland
-
 Syria
Syria
-
 Taiwan
-
 Tajikistan
-
 Tanzania
-
 Thailand
-
 Trinidad and Tobago
-
 Tunisia
-
 Turkey
-
 UAE
UAE
-
 Uganda
-
 Ukraine
-
 United Kingdom
-
United States
-
 Uruguay
-
 Uzbekistan
-
 Venezuela
-
 Vietnam
-
 Yemen
Yemen
-
 Zambia
-
 Zimbabwe
- Forex
- Crypto
