

+7.45% for Sandbox — oversold signals hint at hesitant recovery

Sandbox (SAND) is trading at $0.0865 after a 7.45% ($0.006) gain today, with prices still well below all key moving averages (MA-20 at $0.1221, MA-50 at $0.1203, and MA-200 at $0.2067). This highlights persistent downward pressure and a continued bearish tone despite today's moderate intraday recovery.
SAND price prediction
Current price:
$0.0614
-0.003
4.60%
Real-time Data
05:30
Daily range
0.0579
 0.0603
0.0603
Weekly range
0.0593
0.0881
0.0881
Loading...
Highlights
- SAND trades at $0.0865, remaining well below all major moving averages (MA-20 $0.1221, MA-50 $0.1203, MA-200 $0.2067), indicating sustained bearish pressure.
- Momentum indicators are bearish: MACD at -0.0156, ADX signals a moderate downtrend, and RSI (33.6), Stoch RSI (18.8), and CCI (-129.5) show deeply oversold conditions.
- Expected five-day range is $0.0820–$0.0915, with bullish breakout need above $0.1240 (Kijun resistance) and downside risk below $0.0800 if support fails.
Weak momentum persists as technical barriers cap upside
The current price of SAND at $0.0865 remains well below all key Moving Averages (MA-20 at $0.1221, MA-50 at $0.1203, and MA-200 at $0.2067), indicating persistent downward pressure across the short, medium, and long term. According to the Ichimoku indicator, the nearest dynamic resistance is the Kijun level at $0.1240, which is well above current levels and reinforces a lack of bullish momentum. Momentum indicators continue to signal weakness: both the MACD and ADX point to a sell bias, with the MACD at -0.0156 and the ADX showing a moderately trending move. The market is registering deeply oversold readings on the RSI (33.6), Stochastic RSI (18.8), and CCI (-129.5). Bull/Bear Power’s negative reading confirms sellers remain in control of intraday activity, and the Awesome Oscillator also supports the prevailing downward trend. Today’s price is up 7.45% ($0.006) after a small gap higher at the open, trading near the middle of today’s range ($0.0843 – $0.0884), with moderate intraday volatility and a tone of hesitant strength toward the highs; however, daily momentum and the underlying indicators remain conflicted and favor caution.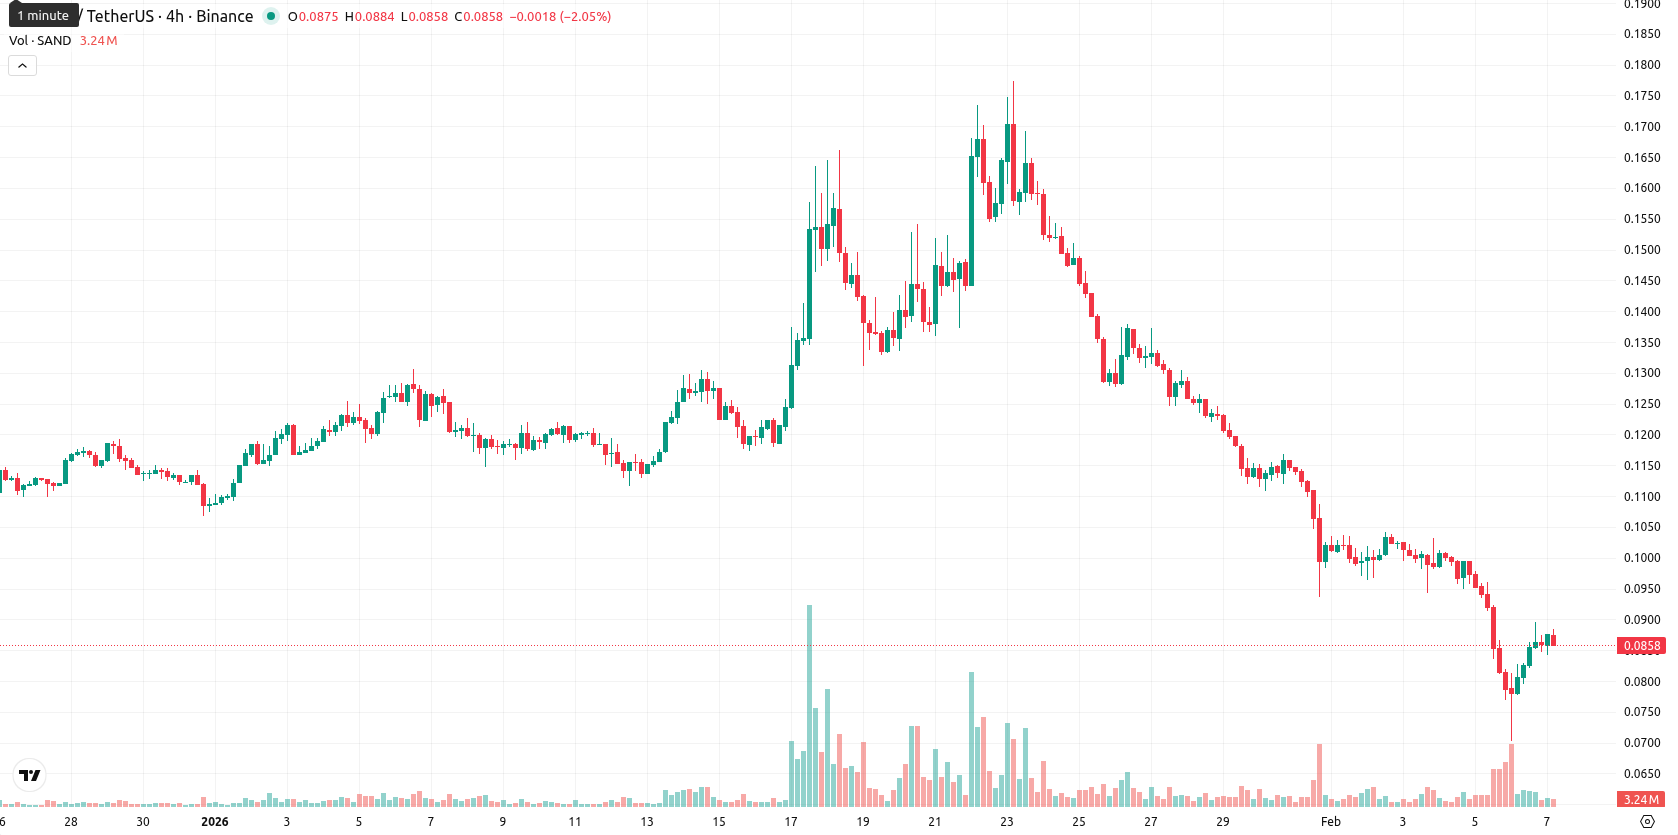
Low upside risk as sideways trade likely to continue
For the next five trading days, the expected range for SAND is $0.0820 to $0.0915, keeping within roughly ±6% of the current price and reflecting ongoing volatility. The probability of a significant price increase is very low (less than 20%), making a downside or sideways move more likely. The baseline scenario is continued sideways consolidation in the $0.0820 – $0.0915 range. A bullish breakout would require the price to decisively clear Ichimoku Kijun resistance at $0.1240, while a bearish case involves a drop below recent lows, potentially accelerating toward the $0.0800 area if support fails.
Anton Kharitonov, expert at Traders Union, sees that SAND remains under notable technical pressure. Downside or sideways movement is more likely, given prices are well below key moving averages and momentum signals are weak. Consolidation near $0.0820 – $0.0915 is the base scenario until resistance above $0.1240 is broken. "Unless SAND reclaims stronger technical levels, I remain cautious and expect further weakness or flat trading ahead."
Previously it was reported that Sandbox (SAND) is exhibiting a strong bearish trend, with the current price trading well below its major moving averages and key technical indicators such as MACD, ADX, and the Awesome Oscillator confirming persistent downward momentum. Despite deeply oversold readings from RSI, Stochastic RSI, and CCI, resistance remains firm near the Ichimoku Kijun level and there is no immediate technical support in play, underscoring the risk of continued weakness.
Source of Data:
SAND Price Analysis by TU
The analysis is based on a proprietary model combining technical, on-chain, and expert data. Not investment advice. See
methodology
The information is based on forecasts and does not constitute investment advice or a guarantee of future results. Market conditions may change. See our Disclaimer and Editorial Integrity for details.
Subscribe to TU news


Did you like the article?




Top News


Top 5 companies for you

United States
-
 Afghanistan
-
 Albania
-
 Algeria
-
 Angola
-
 Argentina
-
 Armenia
-
 Australia
-
 Austria
-
 Azerbaijan
-
 Bahamas
-
 Bahrain
-
 Bangladesh
-
 Belarus
-
 Belgium
-
 Bolivia
-
 Botswana
-
 Brazil
-
 Brunei
-
 Bulgaria
-
 Cambodia
-
 Cameroon
-
 Canada
-
 Chile
Chile
-
 China
China
-
 Colombia
-
 Congo
Congo
-
 Costa Rica
-
 Cote d'Ivoire
-
 Croatia
-
 Cuba
Cuba
-
 Cyprus
-
 Czechia
-
 DR Congo
-
 Denmark
-
 Dominican Republic
-
 Ecuador
-
 Egypt
Egypt
-
 El Salvador
-
 Estonia
-
 Eswatini
-
 Ethiopia
-
 Finland
-
 France
-
 Georgia
-
 Germany
-
 Ghana
Ghana
-
 Greece
-
 Haiti
Haiti
-
 Hong Kong
-
 Hungary
-
 India
India
-
 Indonesia
-
 Iran, Islamic republic
-
 Iraq
Iraq
-
 Ireland
-
 Israel
-
 Italy
Italy
-
 Jamaica
-
 Japan
Japan
-
 Jordan
-
 Kazakhstan
-
 Kenya
Kenya
-
 Korea
Korea
-
 Kuwait
-
 Kyrgyzstan
-
 Laos
Laos
-
 Latvia
-
 Lebanon
-
 Lesotho
-
 Libya
Libya
-
 Lithuania
-
 Luxembourg
-
 Madagascar
-
 Malaysia
-
 Malta
Malta
-
 Mauritius
-
 Mexico
-
 Moldova
-
 Mongolia
-
 Montenegro
-
 Morocco
-
 Mozambique
-
 Myanmar
-
 Namibia
-
 Nepal
Nepal
-
 Netherlands
-
 New Zealand
-
 Nigeria
-
 North Macedonia
-
 Norway
-
 Oman
Oman
-
 Pakistan
-
 Palestine
-
 Panama
-
 Papua New Guinea
-
 Paraguay
-
 Peru
Peru
-
 Philippines
-
 Poland
-
 Portugal
-
 Puerto Rico
-
 Qatar
Qatar
-
 Reunion
-
 Romania
-
 Rwanda
-
 Saudi Arabia
-
 Serbia
-
 Singapore
-
 Slovakia
-
 Slovenia
-
 Somalia
-
 South Africa
-
 Spain
Spain
-
 Sri Lanka
-
 Sweden
-
 Switzerland
-
 Syria
Syria
-
 Taiwan
-
 Tajikistan
-
 Tanzania
-
 Thailand
-
 Trinidad and Tobago
-
 Tunisia
-
 Turkey
-
 UAE
UAE
-
 Uganda
-
 Ukraine
-
 United Kingdom
-
United States
-
 Uruguay
-
 Uzbekistan
-
 Venezuela
-
 Vietnam
-
 Yemen
Yemen
-
 Zambia
-
 Zimbabwe
- Forex
- Crypto










Live News


