
Cosmos: Bullish intraday action drives gains, but warning signs for ATOM remain

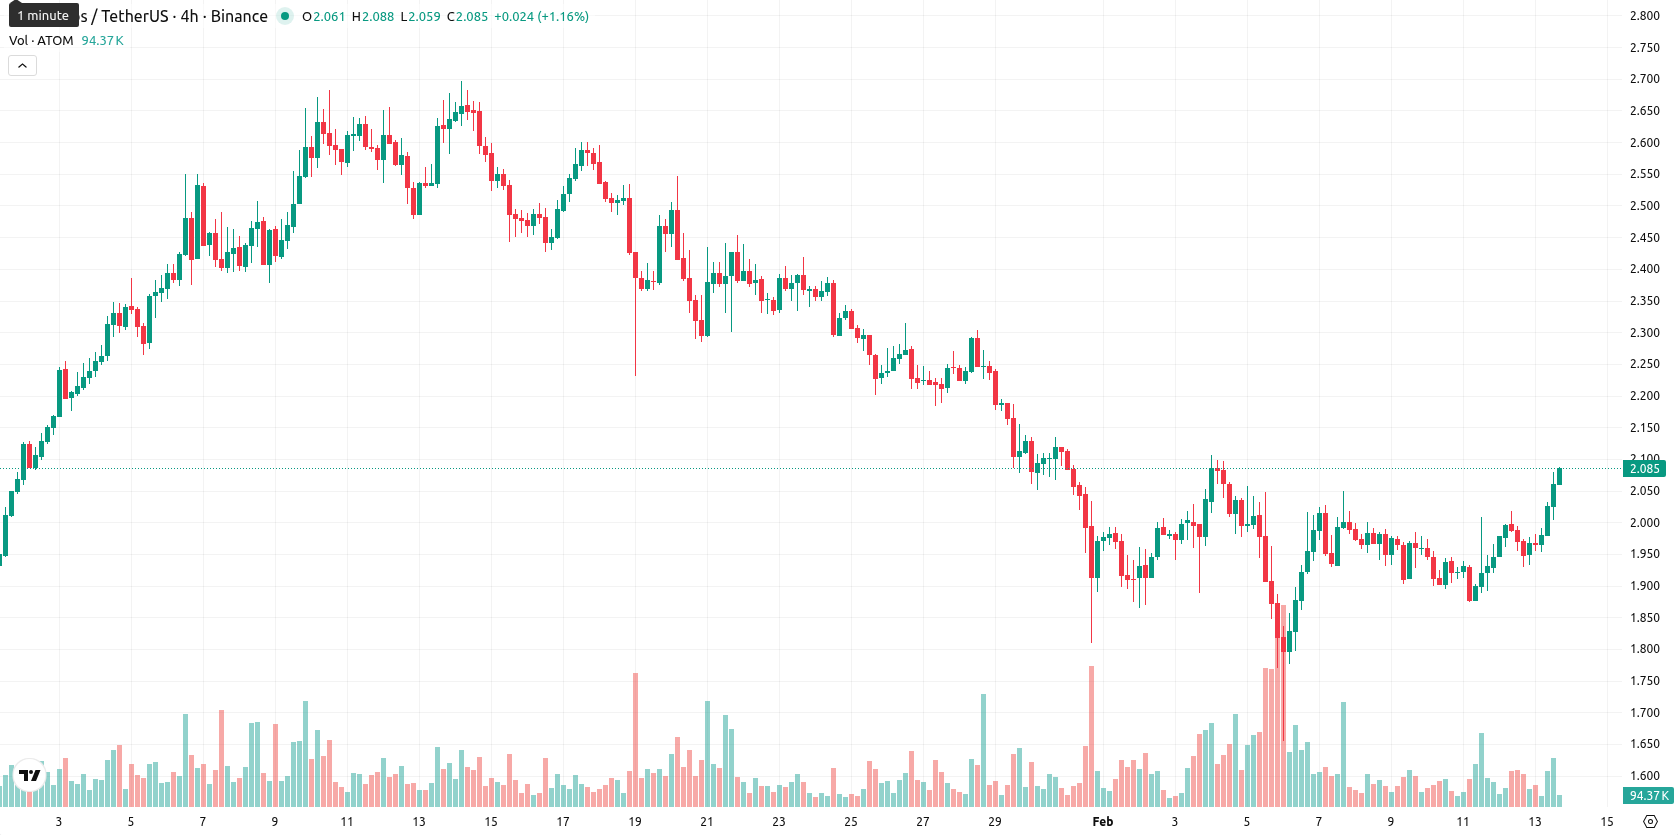
Cosmos (ATOM) is trading at $2.081, sitting slightly above the MA-20 ($2.0476) but below both the MA-50 ($2.2165) and MA-200 ($3.2077), indicating mild short-term strength within an overall bearish medium- and long-term trend. The nearest dynamic support is the Ichimoku Kijun at $2.1245, with resistance set by the MA-50 at $2.2165.
Highlights
- Cosmos implemented 'Real Yield' and advanced the ATOM Economic Zone (AEZ), transitioning ATOM into a productive capital asset with diversified staking revenues from chains like Neutron and Stride.
- Governance changes introduced caps on inflation and Interchain Security (ICS), expanding ATOM’s utility as collateral for new blockchains using Cosmos Hub validators.
- ATOM trades at $2.081, consolidating above MA-20 ($2.0476) but below MA-50 ($2.2165), with technicals showing mixed momentum and a baseline range of $2.04–$2.18 over the next five sessions.
Governance-driven utility rise as tokenomics and AEZ expand ATOM’s role
Cosmos introduced notable changes to its tokenomics and network structure by implementing 'Real Yield' and further developing the ATOM Economic Zone (AEZ), transitioning ATOM into a productive capital asset. Stakers now benefit from diversified revenue streams sourced from consumer chains like Neutron and Stride due to recent governance changes. Caps on inflation and the Interchain Security (ICS) feature, enabling new blockchains to utilize Cosmos Hub validators, underscore ATOM's expanded role as collateral within the ecosystem.
Bearish momentum warnings contrast with overstretched intraday rally
Momentum signals on the daily chart are mixed — MACD gives a Strong Sell, while ADX indicates ongoing trend weakness. The RSI, at 42.38, and CCI suggest the asset is not oversold, but the Stochastic RSI remains at overbought levels (100), highlighting stretched conditions. Bull/Bear Power reveals a slight advantage for buyers, and the Awesome Oscillator remains neutral. Today's trading shows a robust upward movement, gaining 7.38% ($0.143) with no gap at the open and pushing the price near the high of today’s range, pointing to high intraday volatility and strong buyer pressure into the session close. However, the divergence between overbought oscillators and bearish momentum warnings should not be ignored, as it reveals potential for a reversal despite the strong daily performance.
Downside bias persists as consolidation likely within narrow price band
For the next five trading days, the expected price range for ATOM is $2.04 to $2.18, a typical volatility band relative to current levels. The probability of further upside is very low (less than 20%), while a decline is more likely given persistent bearish signals from weekly moving averages, MACD, ADX, and RSI. The baseline scenario is sideways consolidation within this corridor. A bullish move above $2.22 remains unlikely, and a drop below $2.04 could accelerate further weakness toward recent support.
Previously it was reported that Cosmos remains under sustained selling pressure, trading below all key weekly moving averages and dynamic resistance at the Ichimoku Kijun, with technical indicators such as RSI, MACD, and ADX firmly bearish. For the coming week, downside risk persists with weak support around $1.90, and recovery prospects are limited unless a decisive break above resistance occurs.


-
 Afghanistan
-
 Albania
-
 Algeria
-
 Angola
-
 Argentina
-
 Armenia
-
 Australia
-
 Austria
-
 Azerbaijan
-
 Bahamas
-
 Bahrain
-
 Bangladesh
-
 Belarus
-
 Belgium
-
 Bolivia
-
 Botswana
-
 Brazil
-
 Brunei
-
 Bulgaria
-
 Cambodia
-
 Cameroon
-
 Canada
-
 Chile
Chile
-
 China
China
-
 Colombia
-
 Congo
Congo
-
 Costa Rica
-
 Cote d'Ivoire
-
 Croatia
-
 Cuba
Cuba
-
 Cyprus
-
 Czechia
-
 DR Congo
-
 Denmark
-
 Dominican Republic
-
 Ecuador
-
 Egypt
Egypt
-
 El Salvador
-
 Estonia
-
 Eswatini
-
 Ethiopia
-
 Finland
-
 France
-
 Georgia
-
 Germany
-
 Ghana
Ghana
-
 Greece
-
 Haiti
Haiti
-
 Hong Kong
-
 Hungary
-
 India
India
-
 Indonesia
-
 Iran, Islamic republic
-
 Iraq
Iraq
-
 Ireland
-
 Israel
-
 Italy
Italy
-
 Jamaica
-
 Japan
Japan
-
 Jordan
-
 Kazakhstan
-
 Kenya
Kenya
-
 Korea
Korea
-
 Kuwait
-
 Kyrgyzstan
-
 Laos
Laos
-
 Latvia
-
 Lebanon
-
 Lesotho
-
 Libya
Libya
-
 Lithuania
-
 Luxembourg
-
 Madagascar
-
 Malaysia
-
 Malta
Malta
-
 Mauritius
-
 Mexico
-
 Moldova
-
 Mongolia
-
 Montenegro
-
 Morocco
-
 Mozambique
-
 Myanmar
-
 Namibia
-
 Nepal
Nepal
-
 Netherlands
-
 New Zealand
-
 Nigeria
-
 North Macedonia
-
 Norway
-
 Oman
Oman
-
 Pakistan
-
 Palestine
-
 Panama
-
 Papua New Guinea
-
 Paraguay
-
 Peru
Peru
-
 Philippines
-
 Poland
-
 Portugal
-
 Puerto Rico
-
 Qatar
Qatar
-
 Reunion
-
 Romania
-
 Rwanda
-
 Saudi Arabia
-
 Serbia
-
 Singapore
-
 Slovakia
-
 Slovenia
-
 Somalia
-
 South Africa
-
 Spain
Spain
-
 Sri Lanka
-
 Sweden
-
 Switzerland
-
 Syria
Syria
-
 Taiwan
-
 Tajikistan
-
 Tanzania
-
 Thailand
-
 Trinidad and Tobago
-
 Tunisia
-
 Turkey
-
 UAE
UAE
-
 Uganda
-
 Ukraine
-
 United Kingdom
-
United States
-
 Uruguay
-
 Uzbekistan
-
 Venezuela
-
 Vietnam
-
 Yemen
Yemen
-
 Zambia
-
 Zimbabwe
- Forex
- Crypto
