
Mixed technical signals and oversold readings — VeChain gains 7.23%

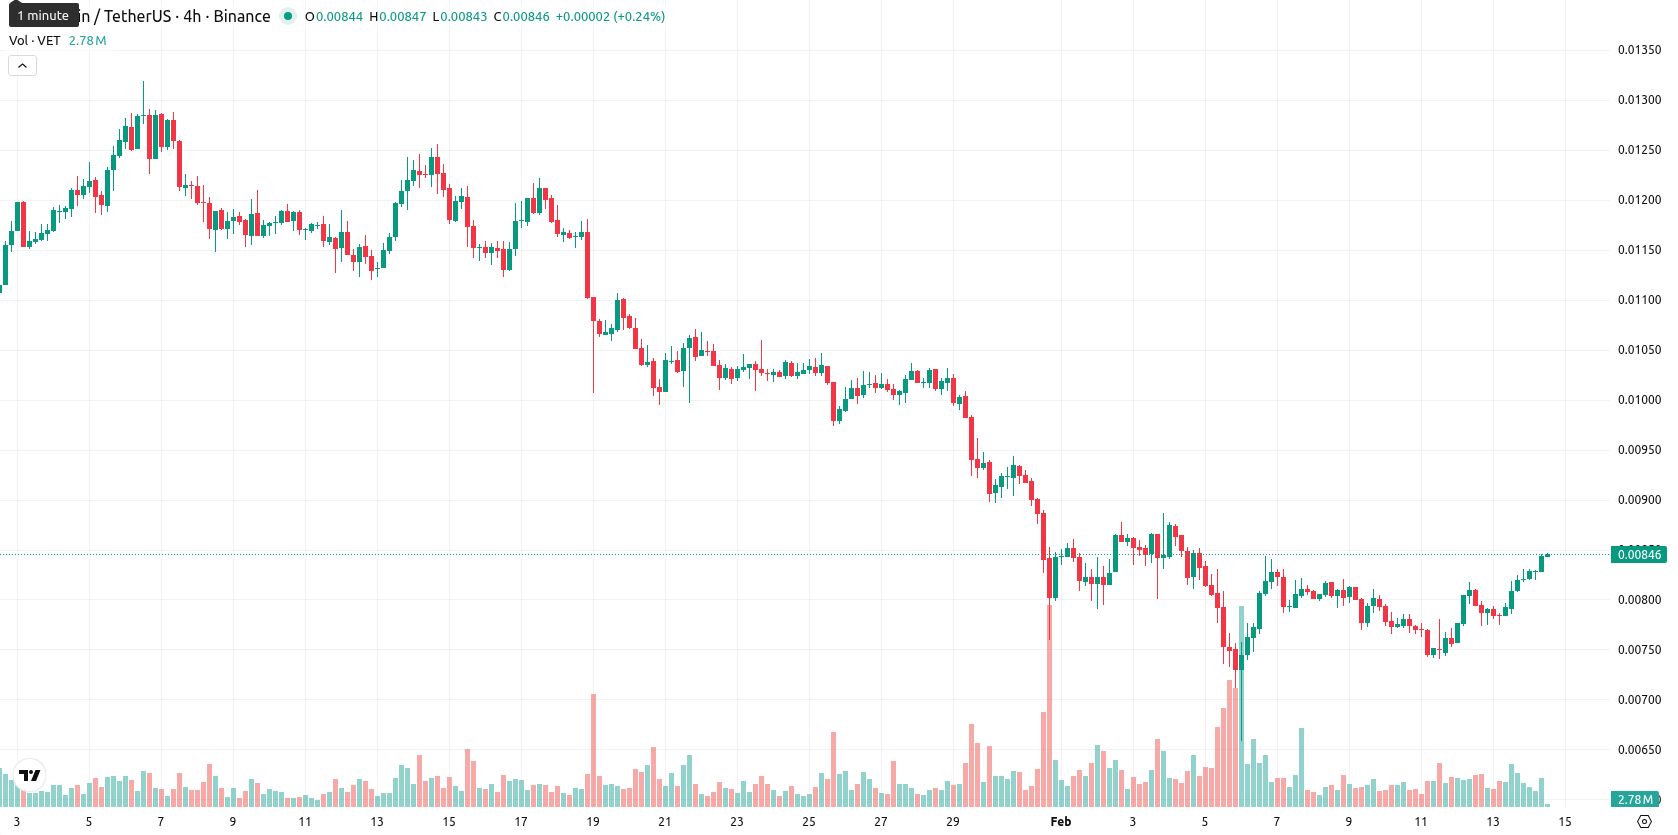
VeChain (VET) is trading at $0.00845, down on the day and positioned below its MA-20 ($0.00860675), MA-50 ($0.01024630), and MA-200 ($0.01689583) averages, indicating ongoing downward pressure across all key timeframes.
Highlights
- VeChain has expanded adoption in Asia, especially China, through collaborations with government bodies and major corporations targeting supply chain and enterprise blockchain integration.
- The network utilizes a dual-token system (VET and VTHO) to support efficient enterprise transactions and is seeing increased institutional and industry engagement.
- VET trades at $0.00845, below major moving averages, with resistance at $0.008825 and a likely price range of $0.00800–$0.00860 amid persistent bearish momentum.
Strategic partnerships in China drive institutional engagement
VeChain's adoption continues to expand in Asia, especially China, where the company has secured collaborations with government bodies and large corporations focused on real-world supply chain and enterprise blockchain integration. The network's dual-token system (VET and VTHO) facilitates efficient transactions for its enterprise applications. Increased trading activity has also reflected heightened institutional and industry engagement with VeChain's technology.
Mixed technical signals as bearish momentum meets short-term divergence
VET remains below all major moving averages (MA-20, MA-50, MA-200), reinforcing downward momentum, while the nearest technical resistance sits at the Ichimoku Kijun level at $0.008825 and the MA-20. No golden or death cross patterns are present. Technical signals are mixed: the MACD indicates a strong sell, and the ADX reveals a robust yet bearish trend, whereas daily and weekly RSI values show persistent selling, with D1 at 41 and W1 deeply oversold at 28. The Stochastic RSI highlights short-term overbought conditions at 100, creating divergence with longer-term weakness. Intraday, Bull/Bear Power points to mild buyer strength, and the Awesome Oscillator is neutral, while VET trades near session highs amid moderate price swings.
Downside risks persist as volatility bands limit upside
For the next five days, VET is likely to stay within a typical volatility band between $0.00800 and $0.00860. Given current technical weakness and overbought short-term signals, further declines are more probable, with a less than 20% chance of an immediate price increase. The base case scenario is for sideways movement between support at $0.00800 and resistance at $0.00860. Should bullish momentum emerge, resistance at $0.008825 could be tested, while a break below $0.00800 would expose VET to additional downside risk.
Previously it was reported that VeChain is trading below its key moving averages, with sustained bearish momentum indicated by MACD, ADX, and oscillators near oversold levels despite a recent intraday bounce. The price faces strong resistance around $0.00940 and is expected to remain rangebound with a downside bias, as technical indicators suggest limited probability of a near-term bullish reversal.


Latest VeChain News


-
 Afghanistan
-
 Albania
-
 Algeria
-
 Angola
-
 Argentina
-
 Armenia
-
 Australia
-
 Austria
-
 Azerbaijan
-
 Bahamas
-
 Bahrain
-
 Bangladesh
-
 Belarus
-
 Belgium
-
 Bolivia
-
 Botswana
-
 Brazil
-
 Brunei
-
 Bulgaria
-
 Cambodia
-
 Cameroon
-
 Canada
-
 Chile
Chile
-
 China
China
-
 Colombia
-
 Congo
Congo
-
 Costa Rica
-
 Cote d'Ivoire
-
 Croatia
-
 Cuba
Cuba
-
 Cyprus
-
 Czechia
-
 DR Congo
-
 Denmark
-
 Dominican Republic
-
 Ecuador
-
 Egypt
Egypt
-
 El Salvador
-
 Estonia
-
 Eswatini
-
 Ethiopia
-
 Finland
-
 France
-
 Georgia
-
 Germany
-
 Ghana
Ghana
-
 Greece
-
 Haiti
Haiti
-
 Hong Kong
-
 Hungary
-
 India
India
-
 Indonesia
-
 Iran, Islamic republic
-
 Iraq
Iraq
-
 Ireland
-
 Israel
-
 Italy
Italy
-
 Jamaica
-
 Japan
Japan
-
 Jordan
-
 Kazakhstan
-
 Kenya
Kenya
-
 Korea
Korea
-
 Kuwait
-
 Kyrgyzstan
-
 Laos
Laos
-
 Latvia
-
 Lebanon
-
 Lesotho
-
 Libya
Libya
-
 Lithuania
-
 Luxembourg
-
 Madagascar
-
 Malaysia
-
 Malta
Malta
-
 Mauritius
-
 Mexico
-
 Moldova
-
 Mongolia
-
 Montenegro
-
 Morocco
-
 Mozambique
-
 Myanmar
-
 Namibia
-
 Nepal
Nepal
-
 Netherlands
-
 New Zealand
-
 Nigeria
-
 North Macedonia
-
 Norway
-
 Oman
Oman
-
 Pakistan
-
 Palestine
-
 Panama
-
 Papua New Guinea
-
 Paraguay
-
 Peru
Peru
-
 Philippines
-
 Poland
-
 Portugal
-
 Puerto Rico
-
 Qatar
Qatar
-
 Reunion
-
 Romania
-
 Rwanda
-
 Saudi Arabia
-
 Serbia
-
 Singapore
-
 Slovakia
-
 Slovenia
-
 Somalia
-
 South Africa
-
 Spain
Spain
-
 Sri Lanka
-
 Sweden
-
 Switzerland
-
 Syria
Syria
-
 Taiwan
-
 Tajikistan
-
 Tanzania
-
 Thailand
-
 Trinidad and Tobago
-
 Tunisia
-
 Turkey
-
 UAE
UAE
-
 Uganda
-
 Ukraine
-
 United Kingdom
-
United States
-
 Uruguay
-
 Uzbekistan
-
 Venezuela
-
 Vietnam
-
 Yemen
Yemen
-
 Zambia
-
 Zimbabwe
- Forex
- Crypto
