
Litecoin climbs as oversold conditions persist, but upward breakout remains unlikely without confirmation – weekly review

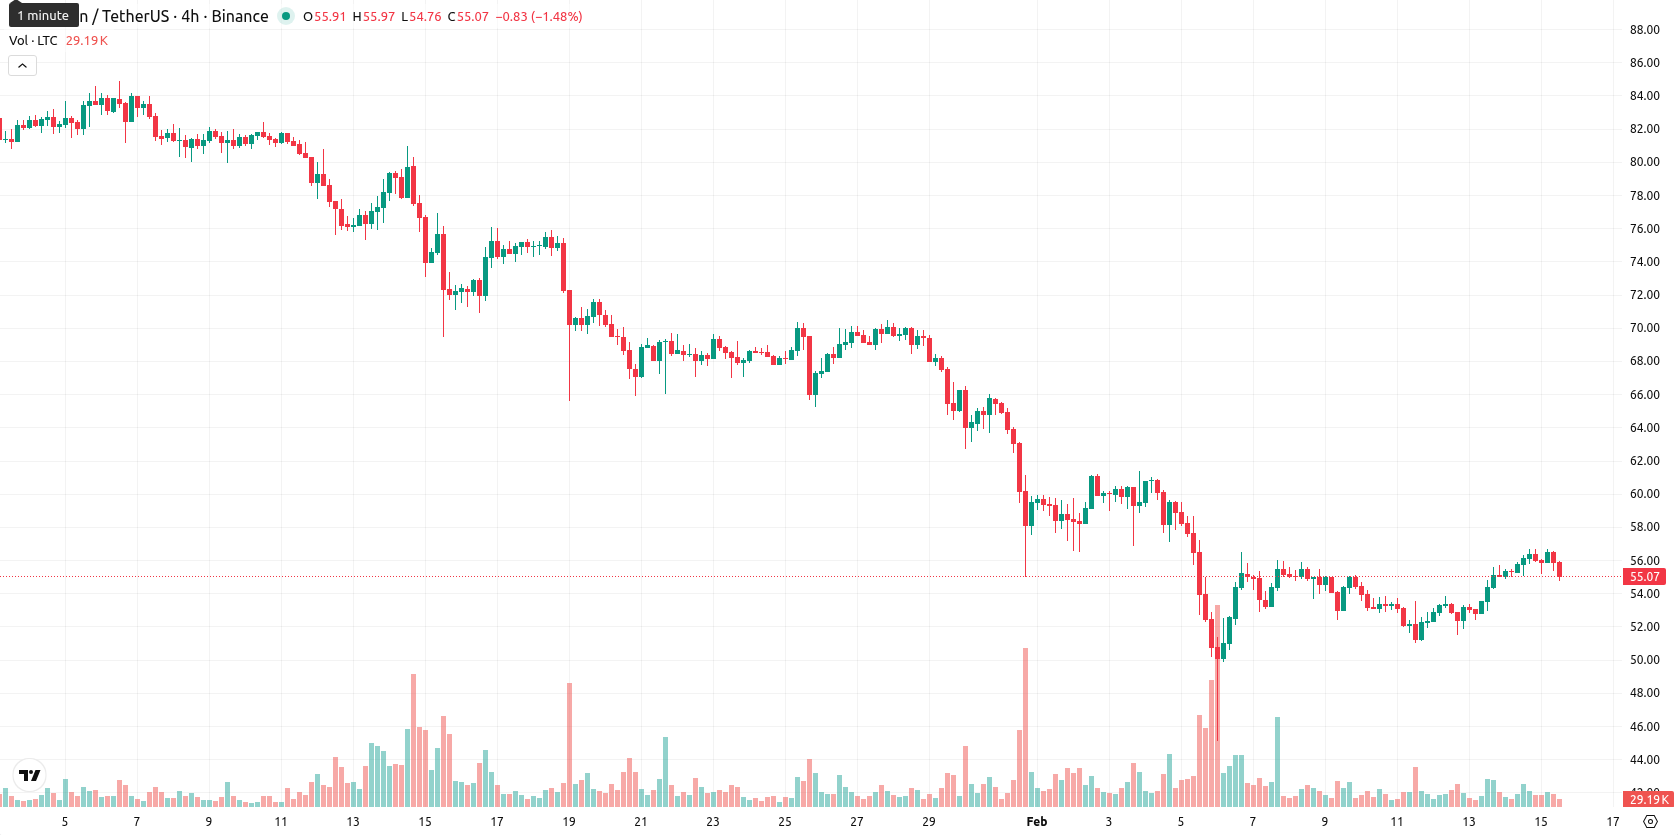
Litecoin (LTC) is currently trading at $55.75, marking a weekly decline, with price action moving lower both in absolute terms and percentage compared to last week. LTC remains below all key weekly moving averages — the MA-20 at $58.86, the MA-50 at $69.45, and the MA-200 at $93.48 — highlighting sustained bearish momentum in both the short and long term.
Highlights
- Litecoin is trading at $55.75, below key moving averages (MA-20: $58.86, MA-50: $69.45, MA-200: $93.48), signaling persistent bearish pressure across all timeframes.
- Momentum signals are mixed, with daily MACD and ADX indicating strong bearish momentum, while oscillator divergences suggest prevailing seller dominance and oversold conditions.
- Expected price range for the next 5 days is $53.00–$58.00; probability of an upward move is below 20%, with further declines more likely unless $58.00 is convincingly broken.
Short-term bullish sentiment rises as adoption and privacy efforts gain traction
Litecoin recently closed a session with a bullish daily candle, reflecting improved short-term momentum in line with broader adoption and its ongoing focus on privacy features. Broader market confirmation is awaited to signal any sustained trend change for LTC. There are no major regulatory or product launch events impacting the asset at this time.
Bearish momentum persists as weekly indicators and resistance converge
On the weekly timeframe, LTC is trading below its 20-, 50-, and 200-week moving averages, showing continued downward pressure. The closest dynamic resistance is at the Ichimoku Kijun ($58.06), while key support sits near recent lows within this week’s price range. Weekly technical indicators paint a mixed outlook: the RSI is in sell territory, indicating continued bearishness, while the Stochastic RSI is overbought and the CCI is neutral, creating conflicting oscillator signals. The ADX confirms strong trend strength on the weekly chart but leans bearish, and the Awesome Oscillator is inconclusive; meanwhile, Bull/Bear Power points to oversold conditions, highlighting sustained dominance by sellers.
Limited upside expected as rangebound trading likely next week
For the next 5–7 trading days, Litecoin is expected to trade in a range between $53.00 and $58.00 based on weekly volatility. The likelihood of a significant upward move is low, with chances estimated at less than 20%, making sideways or downward movement the base scenario. A clear move above $58.00 could open the way to higher resistance, while a close below $53.00 would expose LTC to new multi-week lows.
Last time, analysts noted that Litecoin remains under sustained bearish pressure, trading below all key weekly moving averages and with technical indicators such as the MACD and RSI confirming continued downside momentum. The asset is expected to trade sideways to slightly lower in the near term, with resistance levels limiting upside and a consolidation range likely between $53.00 and $57.00.


-
 Afghanistan
-
 Albania
-
 Algeria
-
 Angola
-
 Argentina
-
 Armenia
-
 Australia
-
 Austria
-
 Azerbaijan
-
 Bahamas
-
 Bahrain
-
 Bangladesh
-
 Belarus
-
 Belgium
-
 Bolivia
-
 Botswana
-
 Brazil
-
 Brunei
-
 Bulgaria
-
 Cambodia
-
 Cameroon
-
 Canada
-
 Chile
Chile
-
 China
China
-
 Colombia
-
 Congo
Congo
-
 Costa Rica
-
 Cote d'Ivoire
-
 Croatia
-
 Cuba
Cuba
-
 Cyprus
-
 Czechia
-
 DR Congo
-
 Denmark
-
 Dominican Republic
-
 Ecuador
-
 Egypt
Egypt
-
 El Salvador
-
 Estonia
-
 Eswatini
-
 Ethiopia
-
 Finland
-
 France
-
 Georgia
-
 Germany
-
 Ghana
Ghana
-
 Greece
-
 Haiti
Haiti
-
 Hong Kong
-
 Hungary
-
 India
India
-
 Indonesia
-
 Iran, Islamic republic
-
 Iraq
Iraq
-
 Ireland
-
 Israel
-
 Italy
Italy
-
 Jamaica
-
 Japan
Japan
-
 Jordan
-
 Kazakhstan
-
 Kenya
Kenya
-
 Korea
Korea
-
 Kuwait
-
 Kyrgyzstan
-
 Laos
Laos
-
 Latvia
-
 Lebanon
-
 Lesotho
-
 Libya
Libya
-
 Lithuania
-
 Luxembourg
-
 Madagascar
-
 Malaysia
-
 Malta
Malta
-
 Mauritius
-
 Mexico
-
 Moldova
-
 Mongolia
-
 Montenegro
-
 Morocco
-
 Mozambique
-
 Myanmar
-
 Namibia
-
 Nepal
Nepal
-
 Netherlands
-
 New Zealand
-
 Nigeria
-
 North Macedonia
-
 Norway
-
 Oman
Oman
-
 Pakistan
-
 Palestine
-
 Panama
-
 Papua New Guinea
-
 Paraguay
-
 Peru
Peru
-
 Philippines
-
 Poland
-
 Portugal
-
 Puerto Rico
-
 Qatar
Qatar
-
 Reunion
-
 Romania
-
 Rwanda
-
 Saudi Arabia
-
 Serbia
-
 Singapore
-
 Slovakia
-
 Slovenia
-
 Somalia
-
 South Africa
-
 Spain
Spain
-
 Sri Lanka
-
 Sweden
-
 Switzerland
-
 Syria
Syria
-
 Taiwan
-
 Tajikistan
-
 Tanzania
-
 Thailand
-
 Trinidad and Tobago
-
 Tunisia
-
 Turkey
-
 UAE
UAE
-
 Uganda
-
 Ukraine
-
 United Kingdom
-
United States
-
 Uruguay
-
 Uzbekistan
-
 Venezuela
-
 Vietnam
-
 Yemen
Yemen
-
 Zambia
-
 Zimbabwe
- Forex
- Crypto
