
Litecoin declines with MACD and RSI signaling ongoing weakness, traders eye $53.00 as key support – weekly analysis

Litecoin (LTC) is currently trading at $55.18, marking a modest weekly gain of $1.03 or 1.90%. The asset remains well below key weekly moving averages, with the MA-20 at $63.82, MA-50 at $72.61, and MA-200 at $95.50, highlighting continued downward pressure across all major timeframes.
 47.82
48.28
47.82
48.28
Highlights
- Litecoin remains under persistent selling pressure, trading at $55.18, well below key moving averages: MA-20 at $63.82, MA-50 at $72.61, and MA-200 at $95.50.
- Momentum indicators—including MACD, ADX, daily RSI at 30.72, and CCI at –112.86—continue to signal strong bearish trends on both daily and weekly timeframes.
- The expected five-day range is $53.00 to $57.00, with resistance at $63.02 and a probability under 20% for a sustained upside breakout.
Institutional adoption and payment usage support sentiment amid ecosystem upgrades
Litecoin has expanded its utility as SBI VC Trade in Japan added LTC to its crypto lending program, underscoring growing institutional engagement. The asset's real-world use remains strong, with CoinGate reporting that Litecoin accounted for 17.7% of crypto payments in January, making it the third most used cryptocurrency for transactions. Development continues to focus on the LitVM upgrade, aimed at broadening ecosystem applications and capturing new use cases.
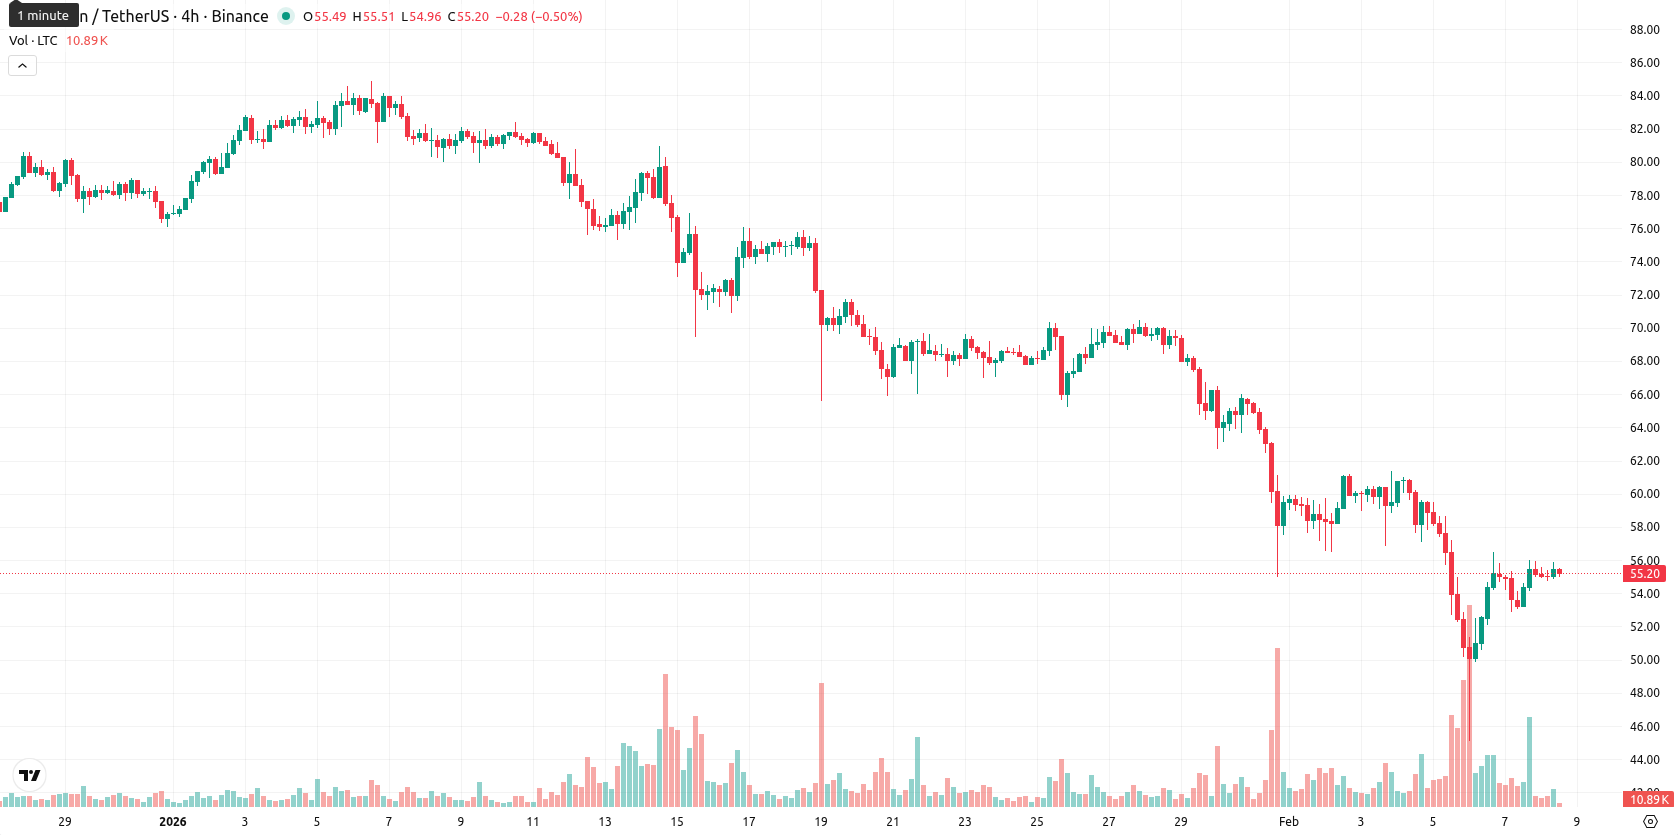
Continued bearish momentum as technical indicators confirm downside dominance
On the weekly (W1) chart, Litecoin is firmly below its principal moving averages, with the MA-20 at $63.82, MA-50 at $72.61, and MA-200 at $95.50, indicating persistent bearish sentiment. The Ichimoku Kijun line at $63.02 currently serves as dynamic resistance, with no substantial support levels nearby. Weekly indicators remain negative — the MACD and ADX confirm strong bearish momentum, while oscillators such as the Awesome Oscillator show ongoing downside pressure; the weekly RSI is at oversold territory, reinforcing prevailing weakness.
Sideways-to-lower bias expected as resistance and sell signals limit upside next week
Over the next five to seven trading days, Litecoin is likely to consolidate within the $53.00 to $57.00 range, as technical signals indicate continued caution and selling pressure. With major resistance levels well above the current price and a cluster of weekly “Sell” indications, a decisive upward move is unlikely unless a breakout above $63.00 occurs. The baseline scenario forecasts sideways or slightly bearish action, but a clear drop below $53.00 could materialize if selling accelerates. Traders should be wary of false rebounds given the prevailing negative outlook on all weekly indicators.
Previously it was reported that Litecoin is trading below major moving averages with persistent bearish momentum, as the price tests multi-year support near $50 amid a prolonged downtrend and repeated failures at resistance in the $60–$70 range. Key technical indicators suggest that a breakdown below $48 could trigger further declines toward $40, while a sustained move above $75 would be needed to signal reversal.









-
 Afghanistan
-
 Albania
-
 Algeria
-
 Angola
-
 Argentina
-
 Armenia
-
 Australia
-
 Austria
-
 Azerbaijan
-
 Bahamas
-
 Bahrain
-
 Bangladesh
-
 Belarus
-
 Belgium
-
 Bolivia
-
 Botswana
-
 Brazil
-
 Brunei
-
 Bulgaria
-
 Cambodia
-
 Cameroon
-
 Canada
-
 Chile
Chile
-
 China
China
-
 Colombia
-
 Congo
Congo
-
 Costa Rica
-
 Cote d'Ivoire
-
 Croatia
-
 Cuba
Cuba
-
 Cyprus
-
 Czechia
-
 DR Congo
-
 Denmark
-
 Dominican Republic
-
 Ecuador
-
 Egypt
Egypt
-
 El Salvador
-
 Estonia
-
 Eswatini
-
 Ethiopia
-
 Finland
-
 France
-
 Georgia
-
 Germany
-
 Ghana
Ghana
-
 Greece
-
 Haiti
Haiti
-
 Hong Kong
-
 Hungary
-
 India
India
-
 Indonesia
-
 Iran, Islamic republic
-
 Iraq
Iraq
-
 Ireland
-
 Israel
-
 Italy
Italy
-
 Jamaica
-
 Japan
Japan
-
 Jordan
-
 Kazakhstan
-
 Kenya
Kenya
-
 Korea
Korea
-
 Kuwait
-
 Kyrgyzstan
-
 Laos
Laos
-
 Latvia
-
 Lebanon
-
 Lesotho
-
 Libya
Libya
-
 Lithuania
-
 Luxembourg
-
 Madagascar
-
 Malaysia
-
 Malta
Malta
-
 Mauritius
-
 Mexico
-
 Moldova
-
 Mongolia
-
 Montenegro
-
 Morocco
-
 Mozambique
-
 Myanmar
-
 Namibia
-
 Nepal
Nepal
-
 Netherlands
-
 New Zealand
-
 Nigeria
-
 North Macedonia
-
 Norway
-
 Oman
Oman
-
 Pakistan
-
 Palestine
-
 Panama
-
 Papua New Guinea
-
 Paraguay
-
 Peru
Peru
-
 Philippines
-
 Poland
-
 Portugal
-
 Puerto Rico
-
 Qatar
Qatar
-
 Reunion
-
 Romania
-
 Rwanda
-
 Saudi Arabia
-
 Serbia
-
 Singapore
-
 Slovakia
-
 Slovenia
-
 Somalia
-
 South Africa
-
 Spain
Spain
-
 Sri Lanka
-
 Sweden
-
 Switzerland
-
 Syria
Syria
-
 Taiwan
-
 Tajikistan
-
 Tanzania
-
 Thailand
-
 Trinidad and Tobago
-
 Tunisia
-
 Turkey
-
 UAE
UAE
-
 Uganda
-
 Ukraine
-
 United Kingdom
-
United States
-
 Uruguay
-
 Uzbekistan
-
 Venezuela
-
 Vietnam
-
 Yemen
Yemen
-
 Zambia
-
 Zimbabwe
- Forex
- Crypto












