

Polkadot drops 1.47% as persistent weakness below key moving averages signals continued bearish pressure – weekly outlook

Polkadot (DOT) closed the week at $1.34, declining by $0.02 or 1.47% over the last seven days. The asset remains under pressure, currently trading below the weekly MA-20 ($1.355), MA-50 ($1.739), and MA-200 ($2.810), underscoring ongoing weakness relative to all major time-based moving averages.
DOT price prediction
Current price:
$0.668
-0.036
5.11%
Real-time Data
02:01
Daily range
0.661
 0.664
0.664
Weekly range
0.650
0.747
0.747
Loading...
Highlights
- DOT trades at $1.34, below MA-20 ($1.355), MA-50 ($1.739), and MA-200 ($2.810), indicating persistent bearish sentiment across all time frames.
- Momentum indicators are mixed—MACD gives a strong sell signal, ADX is high, RSI is weak at 41, and Stochastic RSI is overbought, reflecting significant divergence in market sentiment.
- Expected 5-day price range for DOT is $1.21–$1.47 with less than 20% probability of short-term price increase; primary trend remains sideways to bearish unless $1.50 resistance is breached.
Parachain migration and upcoming halving drive network and market activity
Polkadot recently completed a major hub migration, shifting key functions like token transfers, staking, and governance from the Relay Chain to the Polkadot Asset Hub parachain as of November 4, 2025. The Asset Hub has since processed significant activity, with around 668,000 transactions recorded on February 19, 2026, underscoring the growing role of parachains in network operations. The network also saw its market capitalization reach $2.28 billion and daily trading volumes top $115.63 million as of February 21, 2026. A halving event is scheduled for March 14, 2026, which may impact token issuance.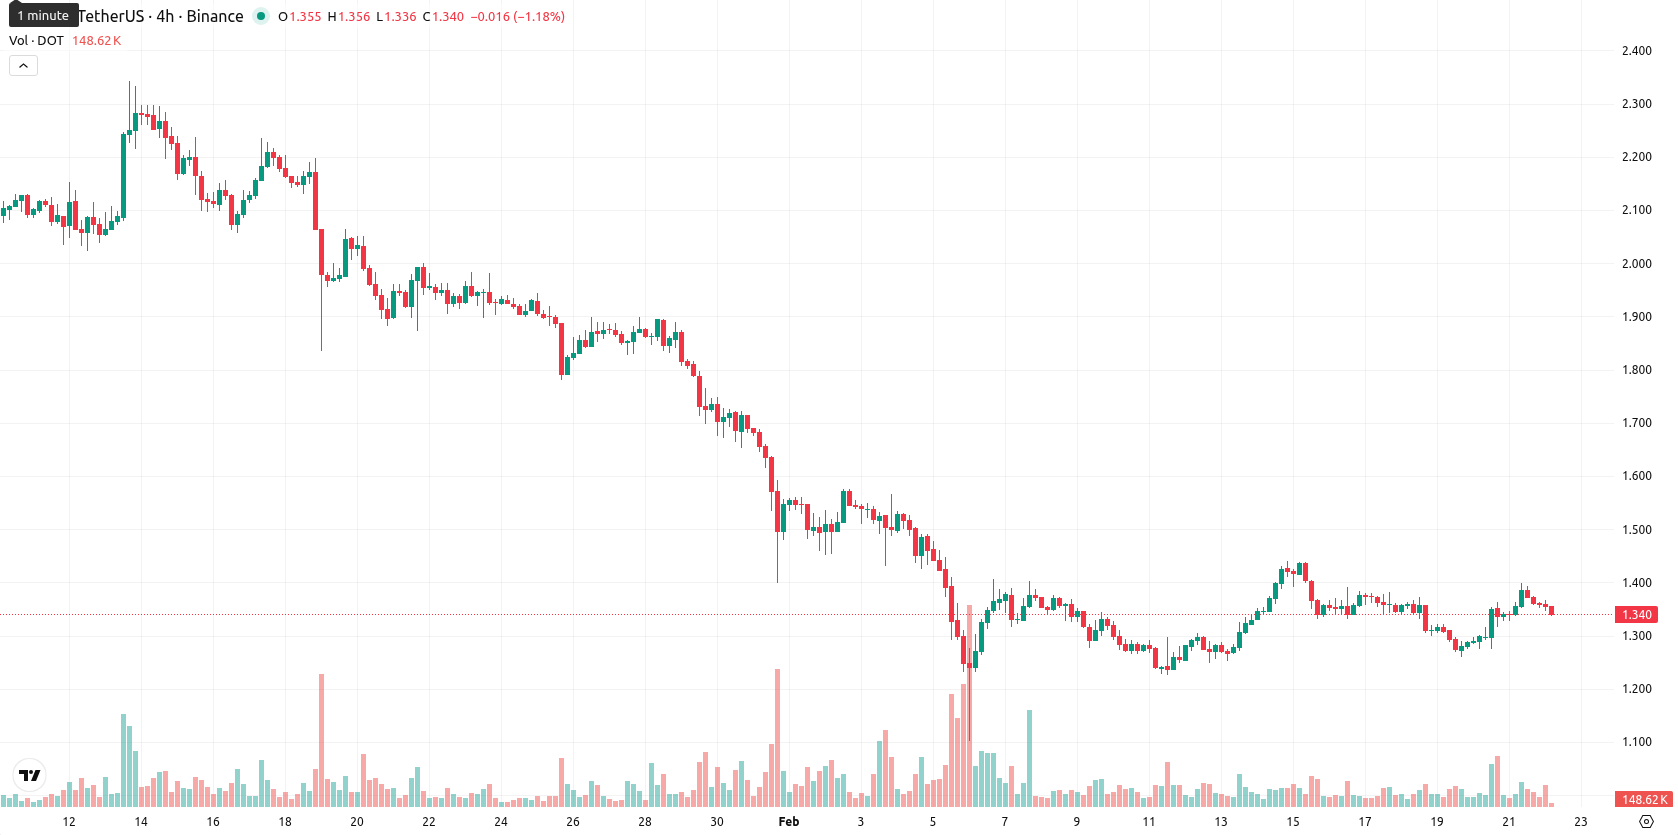
Bearish technical momentum prevails amid failure to reclaim resistance levels
On the weekly chart, DOT continues to trade below all major moving averages: MA-20 ($1.355), MA-50 ($1.739), and MA-200 ($2.810), confirming persistent downside pressure in the short, medium, and long term. The nearest dynamic resistance is seen at the Ichimoku Kijun around $1.50, while support aligns with the recent lows near $1.34. Weekly RSI stands weak at 41, indicating limited bullish momentum, and other W1 momentum indicators suggest a lack of strong oversold conditions, supporting the bearish technical outlook.Sideways range expected as bearish trend and low breakout odds persist
For the next 5–7 trading days, DOT is expected to trade sideways within the $1.21 to $1.47 range, as supported by the current W1 technical setup. Downward momentum persists, and the probability of a sustained price increase is low (less than 20%). Unless buyers quickly gain control and push prices above $1.50, the baseline scenario sees DOT consolidating or potentially testing support below $1.21 in a continued bearish environment.
Viktoras Karapetjanc, analyst at Traders Union, sees Polkadot’s recent technical and fundamental activity as an early signal of transformation. He notes the hub migration and upcoming halving as key strategic drivers, with growing network activity and robust trading volumes underpinning longer-term prospects. Despite another week of price pressure and DOT trading below all major moving averages, Karapetjanc believes the fundamentals are quietly improving beneath the surface. Over the coming week, he expects price consolidation within the $1.21 to $1.47 range, with buyers needing to reclaim $1.50 to unlock further recovery. "I view this sideways phase as a foundation for future upside — and believe Polkadot’s evolving network structure will offer new bullish opportunities once momentum shifts."
Previously it was reported that Polkadot is exhibiting limited upside as it trades above its short-term moving average but remains below key medium- and long-term resistance levels, with mixed momentum indicators suggesting sellers retain control. Technical signals, including a bearish MACD, elevated ADX, and overbought Stochastic RSI, point to the risk of a short-term pullback unless the price decisively breaks above key resistance.
Source of Data:
DOT Price Analysis by TU
The analysis is based on a proprietary model combining technical, on-chain, and expert data. Not investment advice. See
methodology
This material may contain third-party opinions, none of the data and information on this webpage constitutes investment advice according to our Disclaimer. While we adhere to strict Editorial Integrity, this post may contain references to products from our partners.
Subscribe to TU news


Did you like the article?






Top News


Top 5 companies for you

United States
-
 Afghanistan
-
 Albania
-
 Algeria
-
 Angola
-
 Argentina
-
 Armenia
-
 Australia
-
 Austria
-
 Azerbaijan
-
 Bahamas
-
 Bahrain
-
 Bangladesh
-
 Belarus
-
 Belgium
-
 Bolivia
-
 Botswana
-
 Brazil
-
 Brunei
-
 Bulgaria
-
 Cambodia
-
 Cameroon
-
 Canada
-
 Chile
-
 China
-
 Colombia
-
 Congo
-
 Costa Rica
-
 Cote d'Ivoire
-
 Croatia
-
 Cuba
-
 Cyprus
-
 Czechia
-
 DR Congo
-
 Denmark
-
 Dominican Republic
-
 Ecuador
-
 Egypt
-
 El Salvador
-
 Estonia
-
 Eswatini
-
 Ethiopia
-
 Finland
-
 France
-
 Georgia
-
 Germany
-
 Ghana
-
 Greece
-
 Haiti
-
 Hong Kong
-
 Hungary
-
 India
-
 Indonesia
-
 Iran, Islamic republic
-
 Iraq
-
 Ireland
-
 Israel
-
 Italy
-
 Jamaica
-
 Japan
-
 Jordan
-
 Kazakhstan
-
 Kenya
-
 Korea
-
 Kuwait
-
 Kyrgyzstan
-
 Laos
-
 Latvia
-
 Lebanon
-
 Lesotho
-
 Libya
-
 Lithuania
-
 Luxembourg
-
 Madagascar
-
 Malaysia
-
 Malta
-
 Mauritius
-
 Mexico
-
 Moldova
-
 Mongolia
-
 Montenegro
-
 Morocco
-
 Mozambique
-
 Myanmar
-
 Namibia
-
 Nepal
-
 Netherlands
-
 New Zealand
-
 Nigeria
-
 North Macedonia
-
 Norway
-
 Oman
-
 Pakistan
-
 Palestine
-
 Panama
-
 Papua New Guinea
-
 Paraguay
-
 Peru
-
 Philippines
-
 Poland
-
 Portugal
-
 Puerto Rico
-
 Qatar
-
 Reunion
-
 Romania
-
 Rwanda
-
 Saudi Arabia
-
 Serbia
-
 Singapore
-
 Slovakia
-
 Slovenia
-
 Somalia
-
 South Africa
-
 Spain
-
 Sri Lanka
-
 Sweden
-
 Switzerland
-
 Syria
-
 Taiwan
-
 Tajikistan
-
 Tanzania
-
 Thailand
-
 Trinidad and Tobago
-
 Tunisia
-
 Turkey
-
 UAE
-
 Uganda
-
 Ukraine
-
 United Kingdom
-
United States
-
 Uruguay
-
 Uzbekistan
-
 Venezuela
-
 Vietnam
-
 Yemen
-
 Zambia
-
 Zimbabwe
- Forex
- Crypto










Live News


