
Bitcoin Cash price prediction: Further weakness likely as BCH slides below key averages

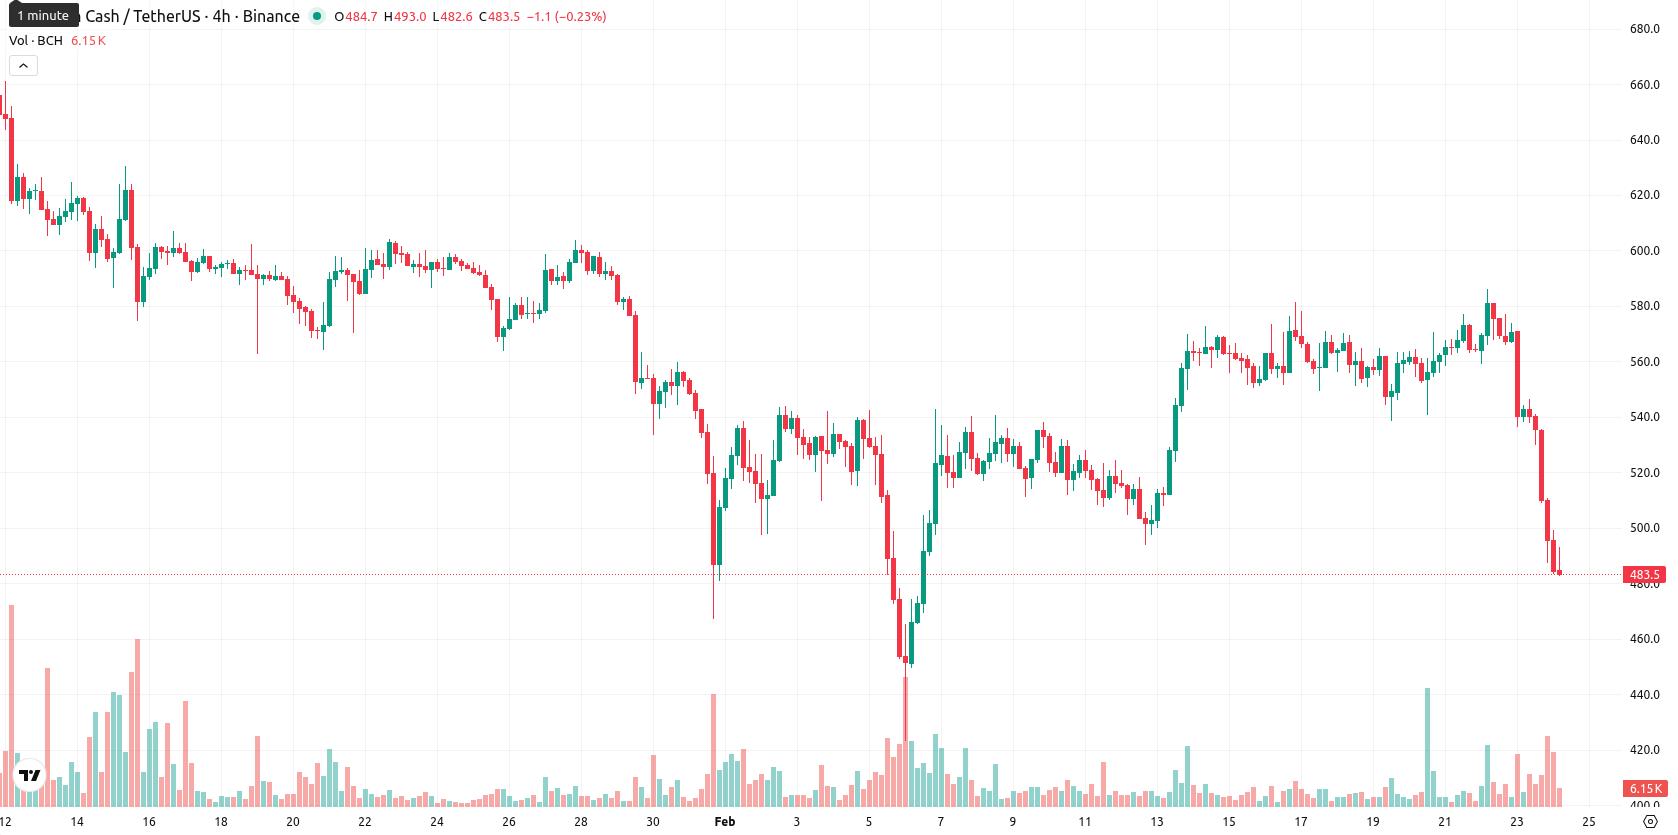
Bitcoin Cash (BCH) is under pressure as the price ($484.20) sits well below the MA-20 ($538.37), MA-50 ($570.44), and MA-200 ($561.23), signaling persistent bearish momentum in the short, medium, and long-term outlooks. The Ichimoku Kijun, at $507.20, stands above the market and acts as immediate resistance.
Highlights
- Bitcoin Cash trades at $484.20, remaining well below MA-20 ($538.37), MA-50 ($570.44), and MA-200 ($561.23), indicating strong bearish momentum across all timeframes.
- Momentum indicators are negative—MACD signals a continued sell-off, ADX at 32.71 shows a firm downtrend, and RSI stands at a weak 38.58.
- Key levels: $507.20 (immediate resistance); $483–$499 (current volatile range); a break below $435 could trigger further declines and new weekly lows.
Oversold signals persist as volatility spikes after gap-down open
Momentum indicators are negative across the board: the MACD signals a continued sell-off, while the ADX at 32.71 indicates a strong, established downward trend. The RSI (38.58) is in lower territory, and the Stochastic RSI on the daily and weekly is oversold. The CCI is negative, reflecting oversold conditions but without evidence of reversal. Bull/Bear Power shows sellers dominating, and the Awesome Oscillator’s neutral stance does not contradict the ongoing downward trend. The session opened dramatically lower with a gap down from the previous close, and the current price is pinned near today’s low within a constrained $483 – $499 range, reflecting high intraday volatility and pressure from sellers since the open. Although most momentum and oscillators align to the downside, oversold readings hint at a possible near-term pause or volatility rather than an immediate reversal.
Downward bias remains as upside breakout odds stay low
Looking ahead over the next five days, the expected price range is $435 – $495, which remains within the typical volatility band relative to current levels. Probability calculations suggest there is less than a 20% chance of a meaningful price increase, indicating further declines are more likely in the short term. Baseline scenario: price consolidates sideways between current support and resistance with volatility persisting. A recovery above $507.20 would improve the technical outlook, while a break below $435 could trigger additional seller activity and force new weekly lows.
Last time, analysts noted that Bitcoin Cash has breached key moving averages, with price action confirming renewed selling pressure and putting the long-term trend at risk unless buyers return. Momentum indicators send mixed signals, but short-term bearish momentum and high volatility dominate, with immediate support at the Ichimoku Kijun and resistance at the MA-50 and the $600 round level.


Latest Bitcoin Cash News


-
 Afghanistan
-
 Albania
-
 Algeria
-
 Angola
-
 Argentina
-
 Armenia
-
 Australia
-
 Austria
-
 Azerbaijan
-
 Bahamas
-
 Bahrain
-
 Bangladesh
-
 Belarus
-
 Belgium
-
 Bolivia
-
 Botswana
-
 Brazil
-
 Brunei
-
 Bulgaria
-
 Cambodia
-
 Cameroon
-
 Canada
-
 Chile
Chile
-
 China
China
-
 Colombia
-
 Congo
Congo
-
 Costa Rica
-
 Cote d'Ivoire
-
 Croatia
-
 Cuba
Cuba
-
 Cyprus
-
 Czechia
-
 DR Congo
-
 Denmark
-
 Dominican Republic
-
 Ecuador
-
 Egypt
Egypt
-
 El Salvador
-
 Estonia
-
 Eswatini
-
 Ethiopia
-
 Finland
-
 France
-
 Georgia
-
 Germany
-
 Ghana
Ghana
-
 Greece
-
 Haiti
Haiti
-
 Hong Kong
-
 Hungary
-
 India
India
-
 Indonesia
-
 Iran, Islamic republic
-
 Iraq
Iraq
-
 Ireland
-
 Israel
-
 Italy
Italy
-
 Jamaica
-
 Japan
Japan
-
 Jordan
-
 Kazakhstan
-
 Kenya
Kenya
-
 Korea
Korea
-
 Kuwait
-
 Kyrgyzstan
-
 Laos
Laos
-
 Latvia
-
 Lebanon
-
 Lesotho
-
 Libya
Libya
-
 Lithuania
-
 Luxembourg
-
 Madagascar
-
 Malaysia
-
 Malta
Malta
-
 Mauritius
-
 Mexico
-
 Moldova
-
 Mongolia
-
 Montenegro
-
 Morocco
-
 Mozambique
-
 Myanmar
-
 Namibia
-
 Nepal
Nepal
-
 Netherlands
-
 New Zealand
-
 Nigeria
-
 North Macedonia
-
 Norway
-
 Oman
Oman
-
 Pakistan
-
 Palestine
-
 Panama
-
 Papua New Guinea
-
 Paraguay
-
 Peru
Peru
-
 Philippines
-
 Poland
-
 Portugal
-
 Puerto Rico
-
 Qatar
Qatar
-
 Reunion
-
 Romania
-
 Rwanda
-
 Saudi Arabia
-
 Serbia
-
 Singapore
-
 Slovakia
-
 Slovenia
-
 Somalia
-
 South Africa
-
 Spain
Spain
-
 Sri Lanka
-
 Sweden
-
 Switzerland
-
 Syria
Syria
-
 Taiwan
-
 Tajikistan
-
 Tanzania
-
 Thailand
-
 Trinidad and Tobago
-
 Tunisia
-
 Turkey
-
 UAE
UAE
-
 Uganda
-
 Ukraine
-
 United Kingdom
-
United States
-
 Uruguay
-
 Uzbekistan
-
 Venezuela
-
 Vietnam
-
 Yemen
Yemen
-
 Zambia
-
 Zimbabwe
- Forex
- Crypto
