
Bitcoin Cash price prediction: More downside ahead? BCH drops 7.05%

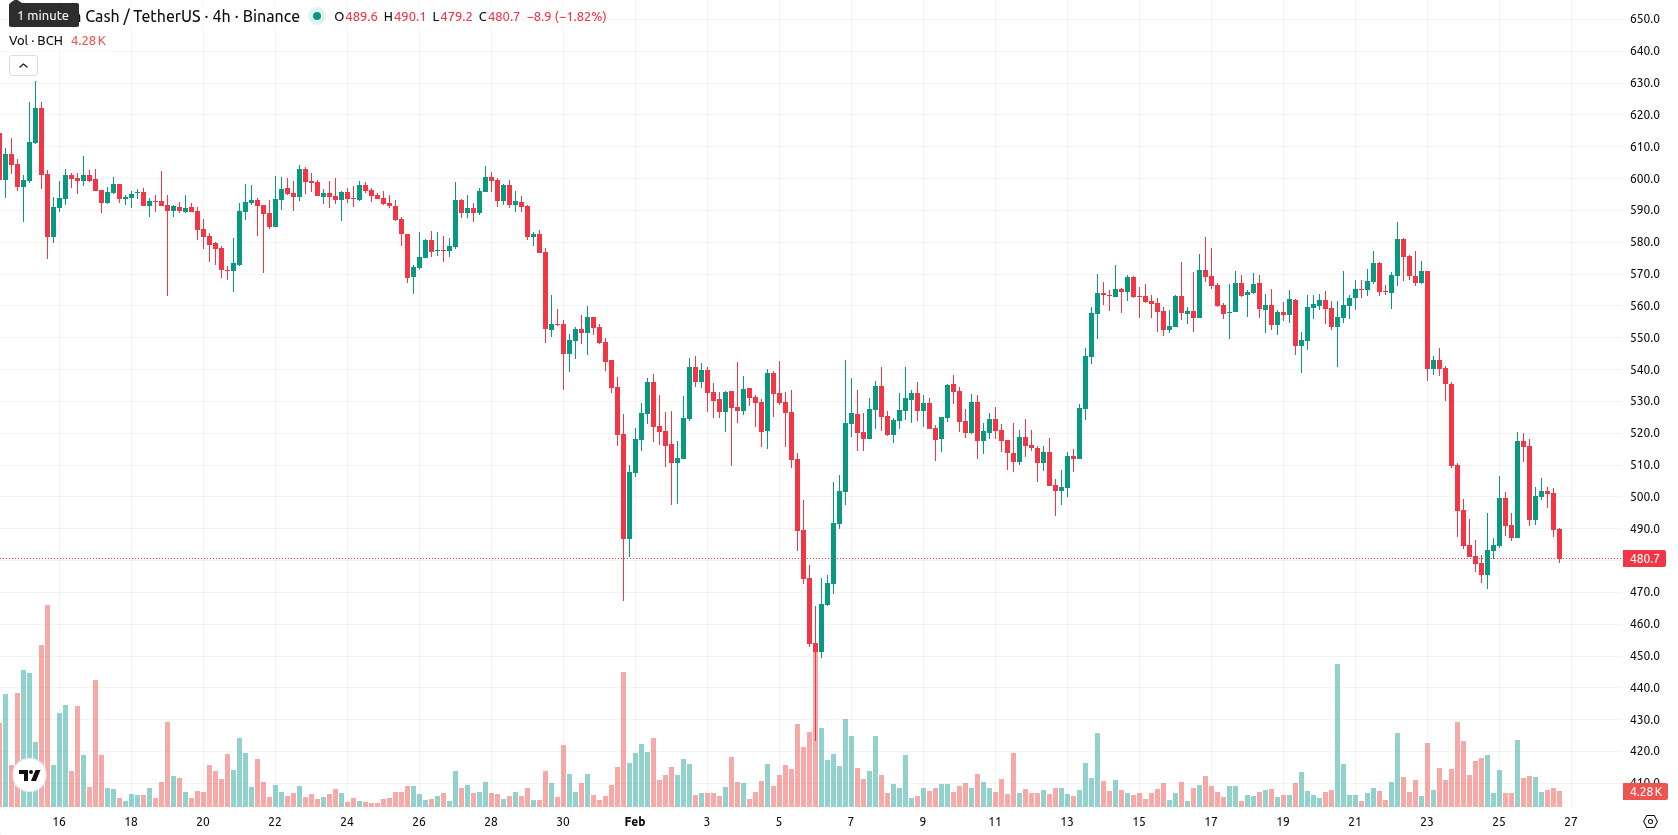
Bitcoin Cash (BCH) is trading at $481.40 after a daily drop of 7.05%. The asset remains well below its short-, medium-, and long-term moving averages, highlighting persistent downside pressure.
Highlights
- Bitcoin Cash trades at $481.40, sharply below its MA-20 ($537.90), MA-50 ($564.31), and MA-200 ($560.36), underscoring persistent bearish pressure.
- Momentum indicators including daily MACD, ADX, and multiple oscillators signal downside with persistent oversold conditions and dominant intraday seller strength.
- Expected five-day trading range is $435.00–$485.00, with less than 20% probability of a short-term rally and $504.60 as key resistance.
Bearish indicators intensify as momentum diverges from rare positive signal
BCH remains firmly beneath the MA-20 ($537.90), MA-50 ($564.31), and MA-200 ($560.36) across all timeframes. The Ichimoku Kijun at $504.60 is the nearest resistance. Daily momentum remains negative, with MACD and ADX confirming a strong downside bias. RSI and Stochastic RSI both indicate oversold conditions, the Commodity Channel Index signals a persistent negative trend, and Bull/Bear Power shows seller dominance intraday. While the Hull Moving Average on the daily timeframe flashes a rare strong buy, this stands in contrast to the majority of bearish momentum indicators.
Downside risks mount as volatility expected to remain elevated
Looking ahead, BCH is likely to remain volatile within a typical band between $435.00 and $485.00 over the next five trading days. The probability of a price increase in the short term is very low (less than 20%), with decline scenarios more probable. Consolidation around current levels is the base expectation, while a break above $504.60 would signal a reversal attempt. Sustained movement below $435.00 would confirm further downside under persistent selling pressure.
Previously it was reported that Bitcoin Cash is trading markedly below its major moving averages, signaling persistent bearish momentum and confirming sellers’ control across multiple timeframes. Technical indicators including a bearish MACD, weak RSI, and oversold oscillators, combined with the price consolidating near weak support at the Ichimoku Kijun, suggest limited prospects for a near-term reversal without a decisive move above resistance.


Latest Bitcoin Cash News


-
 Afghanistan
-
 Albania
-
 Algeria
-
 Angola
-
 Argentina
-
 Armenia
-
 Australia
-
 Austria
-
 Azerbaijan
-
 Bahamas
-
 Bahrain
-
 Bangladesh
-
 Belarus
-
 Belgium
-
 Bolivia
-
 Botswana
-
 Brazil
-
 Brunei
-
 Bulgaria
-
 Cambodia
-
 Cameroon
-
 Canada
-
 Chile
Chile
-
 China
China
-
 Colombia
-
 Congo
Congo
-
 Costa Rica
-
 Cote d'Ivoire
-
 Croatia
-
 Cuba
Cuba
-
 Cyprus
-
 Czechia
-
 DR Congo
-
 Denmark
-
 Dominican Republic
-
 Ecuador
-
 Egypt
Egypt
-
 El Salvador
-
 Estonia
-
 Eswatini
-
 Ethiopia
-
 Finland
-
 France
-
 Georgia
-
 Germany
-
 Ghana
Ghana
-
 Greece
-
 Haiti
Haiti
-
 Hong Kong
-
 Hungary
-
 India
India
-
 Indonesia
-
 Iran, Islamic republic
-
 Iraq
Iraq
-
 Ireland
-
 Israel
-
 Italy
Italy
-
 Jamaica
-
 Japan
Japan
-
 Jordan
-
 Kazakhstan
-
 Kenya
Kenya
-
 Korea
Korea
-
 Kuwait
-
 Kyrgyzstan
-
 Laos
Laos
-
 Latvia
-
 Lebanon
-
 Lesotho
-
 Libya
Libya
-
 Lithuania
-
 Luxembourg
-
 Madagascar
-
 Malaysia
-
 Malta
Malta
-
 Mauritius
-
 Mexico
-
 Moldova
-
 Mongolia
-
 Montenegro
-
 Morocco
-
 Mozambique
-
 Myanmar
-
 Namibia
-
 Nepal
Nepal
-
 Netherlands
-
 New Zealand
-
 Nigeria
-
 North Macedonia
-
 Norway
-
 Oman
Oman
-
 Pakistan
-
 Palestine
-
 Panama
-
 Papua New Guinea
-
 Paraguay
-
 Peru
Peru
-
 Philippines
-
 Poland
-
 Portugal
-
 Puerto Rico
-
 Qatar
Qatar
-
 Reunion
-
 Romania
-
 Rwanda
-
 Saudi Arabia
-
 Serbia
-
 Singapore
-
 Slovakia
-
 Slovenia
-
 Somalia
-
 South Africa
-
 Spain
Spain
-
 Sri Lanka
-
 Sweden
-
 Switzerland
-
 Syria
Syria
-
 Taiwan
-
 Tajikistan
-
 Tanzania
-
 Thailand
-
 Trinidad and Tobago
-
 Tunisia
-
 Turkey
-
 UAE
UAE
-
 Uganda
-
 Ukraine
-
 United Kingdom
-
United States
-
 Uruguay
-
 Uzbekistan
-
 Venezuela
-
 Vietnam
-
 Yemen
Yemen
-
 Zambia
-
 Zimbabwe
- Forex
- Crypto
