
Bitcoin Cash price prediction: Can BCH recover after breaking below key supports?

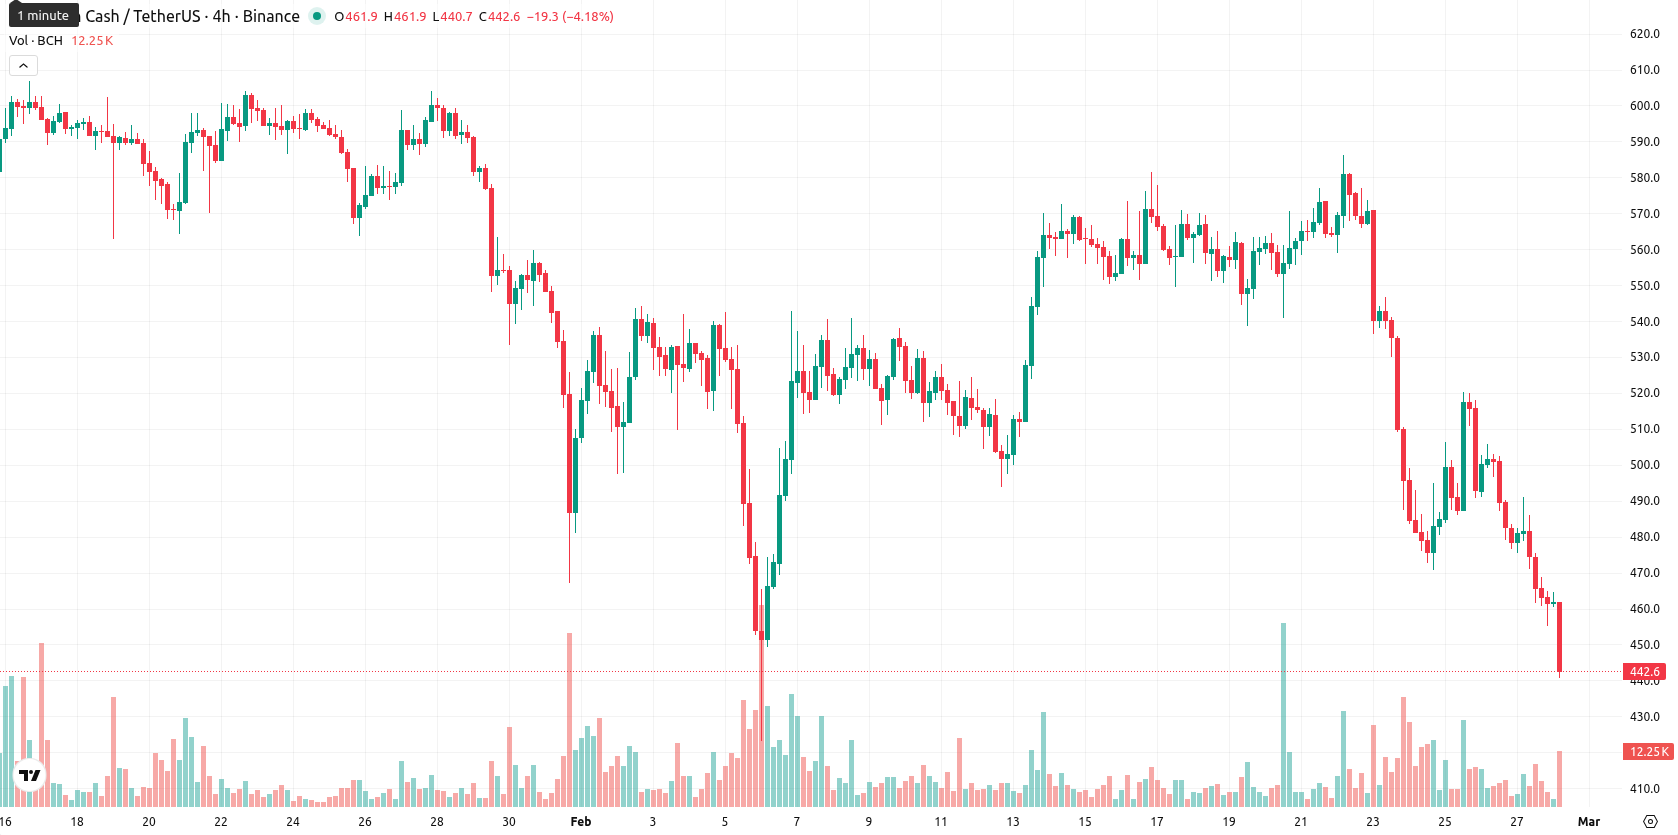
Bitcoin Cash (BCH) is trading at $443, marking a daily decline of 7.67%. The current price is well below the MA-20 ($532.25), MA-50 ($557.80), and MA-200 ($559.29), showing persistent selling pressure across short, medium, and long-term trends.
Highlights
- Bitcoin Cash is trading at $443, well below its MA-20 ($532.25), MA-50 ($557.80), and MA-200 ($559.29), signaling persistent multi-timeframe selling pressure.
- Bearish momentum dominates as MACD, ADX, and Awesome Oscillator confirm a strong downtrend, while RSI and Stochastic RSI indicate deeply oversold conditions.
- Key resistance stands at the Ichimoku Kijun level ($504.60), with downside volatility likely to push BCH towards $400 if $440 support fails.
Bearish momentum intensifies as signals turn deeply oversold
The Ichimoku Kijun level for BCH stands at $504.60, acting as immediate resistance above the current price. Momentum signals remain bearish, with the MACD and ADX on the daily chart confirming a continued downtrend and strong bearish momentum. The RSI, Stochastic RSI, and CCI all indicate oversold conditions, while Bull/Bear Power shows pronounced seller dominance. The Awesome Oscillator aligns with this bearish trend, and the price currently sits near the low end of today's range ($443.2–$464.6), reflecting high volatility and sustained downward pressure after the open.
Sideways-to-lower bias as buy signals remain scarce
For the next five trading days, BCH is expected to trade within a typical volatility band between $398 and $482 based on current levels. With only one out of four main weekly indicators (MA-50, MA-100, MA-200, RSI) suggesting a buy, the probability of a short-term price increase is below 20%, pointing to a higher likelihood of further declines. The base scenario is sideways movement between $398 and $482. If a bullish move occurs above $480, a retest of the Ichimoku resistance is possible, while a break below $440 could accelerate declines toward $400.
Last time, analysts noted that Bitcoin Cash is trading well below key moving averages, with technical indicators such as MACD, ADX, RSI, and CCI confirming persistent downside pressure and seller dominance, despite one isolated bullish signal from the Hull Moving Average. Consolidation is expected within a volatile range near current levels, with a low probability of near-term reversal unless resistance at $504.60 is decisively cleared.


Latest Bitcoin Cash News


-
 Afghanistan
-
 Albania
-
 Algeria
-
 Angola
-
 Argentina
-
 Armenia
-
 Australia
-
 Austria
-
 Azerbaijan
-
 Bahamas
-
 Bahrain
-
 Bangladesh
-
 Belarus
-
 Belgium
-
 Bolivia
-
 Botswana
-
 Brazil
-
 Brunei
-
 Bulgaria
-
 Cambodia
-
 Cameroon
-
 Canada
-
 Chile
Chile
-
 China
China
-
 Colombia
-
 Congo
Congo
-
 Costa Rica
-
 Cote d'Ivoire
-
 Croatia
-
 Cuba
Cuba
-
 Cyprus
-
 Czechia
-
 DR Congo
-
 Denmark
-
 Dominican Republic
-
 Ecuador
-
 Egypt
Egypt
-
 El Salvador
-
 Estonia
-
 Eswatini
-
 Ethiopia
-
 Finland
-
 France
-
 Georgia
-
 Germany
-
 Ghana
Ghana
-
 Greece
-
 Haiti
Haiti
-
 Hong Kong
-
 Hungary
-
 India
India
-
 Indonesia
-
 Iran, Islamic republic
-
 Iraq
Iraq
-
 Ireland
-
 Israel
-
 Italy
Italy
-
 Jamaica
-
 Japan
Japan
-
 Jordan
-
 Kazakhstan
-
 Kenya
Kenya
-
 Korea
Korea
-
 Kuwait
-
 Kyrgyzstan
-
 Laos
Laos
-
 Latvia
-
 Lebanon
-
 Lesotho
-
 Libya
Libya
-
 Lithuania
-
 Luxembourg
-
 Madagascar
-
 Malaysia
-
 Malta
Malta
-
 Mauritius
-
 Mexico
-
 Moldova
-
 Mongolia
-
 Montenegro
-
 Morocco
-
 Mozambique
-
 Myanmar
-
 Namibia
-
 Nepal
Nepal
-
 Netherlands
-
 New Zealand
-
 Nigeria
-
 North Macedonia
-
 Norway
-
 Oman
Oman
-
 Pakistan
-
 Palestine
-
 Panama
-
 Papua New Guinea
-
 Paraguay
-
 Peru
Peru
-
 Philippines
-
 Poland
-
 Portugal
-
 Puerto Rico
-
 Qatar
Qatar
-
 Reunion
-
 Romania
-
 Rwanda
-
 Saudi Arabia
-
 Serbia
-
 Singapore
-
 Slovakia
-
 Slovenia
-
 Somalia
-
 South Africa
-
 Spain
Spain
-
 Sri Lanka
-
 Sweden
-
 Switzerland
-
 Syria
Syria
-
 Taiwan
-
 Tajikistan
-
 Tanzania
-
 Thailand
-
 Trinidad and Tobago
-
 Tunisia
-
 Turkey
-
 UAE
UAE
-
 Uganda
-
 Ukraine
-
 United Kingdom
-
United States
-
 Uruguay
-
 Uzbekistan
-
 Venezuela
-
 Vietnam
-
 Yemen
Yemen
-
 Zambia
-
 Zimbabwe
- Forex
- Crypto
