
Tron stabilizes below resistance while network fundamentals evolve but technicals limit upside – weekly review

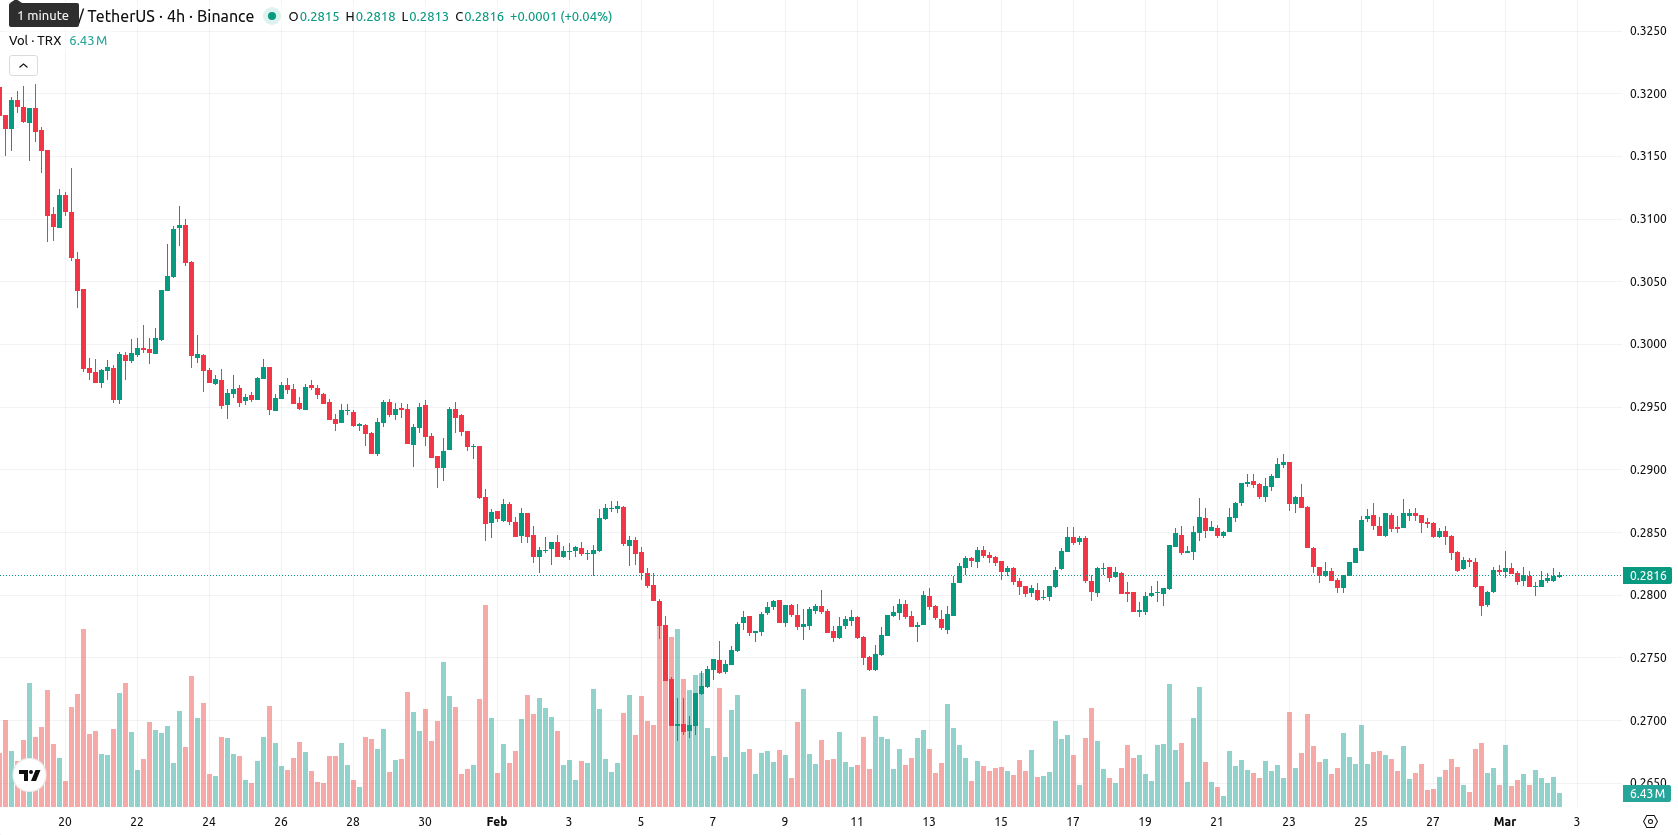
Tron (TRX) is currently trading at $0.2816, reflecting a slight week-over-week decline of 0.11%. The asset remains below its key weekly moving averages — MA-20 at $0.2829, MA-50 at $0.2902, and MA-200 at $0.3058 — underscoring a bearish bias across short-, medium-, and long-term timeframes.
Highlights
- TRX trades at $0.2816, sitting below MA-20 ($0.2829), MA-50 ($0.2902), and MA-200 ($0.3058), confirming a sustained bearish bias across all timeframes.
- Weekly and daily technicals indicate a less than 20% probability of a price increase, with TRX most likely to remain rangebound between $0.2690 and $0.2890.
- A sustained break above $0.2902 is required for a bullish reversal, while a drop below $0.2798 support would reinforce further downside risk.
Ecosystem growth and stablecoin gains buoy sentiment despite price drift
The TRON network continues to expand its ecosystem, with recent supply management adjustments directly tied to network usage and governance through the DAO structure. TRX holders are actively involved in platform governance by voting for Super Representatives. The network’s leading role in stablecoin issuance, highlighted by a $1.6 billion increase in February, and its prioritization of AI infrastructure development for 2026, further support its ongoing evolution.
Bearish momentum entrenched as indicators stay weak over the week
On the weekly (W1) timeframe, TRX remains positioned below all major moving averages, with dynamic resistance near MA-50 at $0.2902 and key support around the Ichimoku Kijun level at $0.2798. Weekly momentum indicators continue to signal bearishness, as the MACD shows a sell bias and the RSI lingers in bearish territory. The Stochastic RSI suggests oversold conditions, while ADX remains neutral, indicating weak trend strength; Commodity Channel Index is neutral and Bull/Bear Power hints at a minor intraday buyer presence, but this diverges from the broader bearish trend.
Rangebound bias expected as oversold signals clash with tepid momentum
For the next 5–7 trading days, TRX is likely to fluctuate within a range of $0.2690 to $0.2890, given persistently weak weekly momentum and lack of directional volatility. While oversold oscillators create the potential for a short-term technical bounce, the probability of a sustained price increase is low, with less than a 20% chance predicted by W1 indicators. The baseline scenario is for rangebound trading, with any notable bullish reversal contingent on a break above $0.2902 resistance, while renewed declines are plausible should support at $0.2798 fail.
Previously it was reported that Tron showed short-term bullish momentum by trading above its MA-20 and Ichimoku Kijun, but remained capped below the MA-50 and well under the MA-200, reflecting an unconfirmed long-term trend reversal. Technical indicators are mixed, with bullish weekly ADX contrasting overbought Stochastic RSI and CCI, leading to expectations of sideways trading with resistance near $0.2922 and support around $0.2825 in the coming week.


-
 Afghanistan
-
 Albania
-
 Algeria
-
 Angola
-
 Argentina
-
 Armenia
-
 Australia
-
 Austria
-
 Azerbaijan
-
 Bahamas
-
 Bahrain
-
 Bangladesh
-
 Belarus
-
 Belgium
-
 Bolivia
-
 Botswana
-
 Brazil
-
 Brunei
-
 Bulgaria
-
 Cambodia
-
 Cameroon
-
 Canada
-
 Chile
Chile
-
 China
China
-
 Colombia
-
 Congo
Congo
-
 Costa Rica
-
 Cote d'Ivoire
-
 Croatia
-
 Cuba
Cuba
-
 Cyprus
-
 Czechia
-
 DR Congo
-
 Denmark
-
 Dominican Republic
-
 Ecuador
-
 Egypt
Egypt
-
 El Salvador
-
 Estonia
-
 Eswatini
-
 Ethiopia
-
 Finland
-
 France
-
 Georgia
-
 Germany
-
 Ghana
Ghana
-
 Greece
-
 Haiti
Haiti
-
 Hong Kong
-
 Hungary
-
 India
India
-
 Indonesia
-
 Iran, Islamic republic
-
 Iraq
Iraq
-
 Ireland
-
 Israel
-
 Italy
Italy
-
 Jamaica
-
 Japan
Japan
-
 Jordan
-
 Kazakhstan
-
 Kenya
Kenya
-
 Korea
Korea
-
 Kuwait
-
 Kyrgyzstan
-
 Laos
Laos
-
 Latvia
-
 Lebanon
-
 Lesotho
-
 Libya
Libya
-
 Lithuania
-
 Luxembourg
-
 Madagascar
-
 Malaysia
-
 Malta
Malta
-
 Mauritius
-
 Mexico
-
 Moldova
-
 Mongolia
-
 Montenegro
-
 Morocco
-
 Mozambique
-
 Myanmar
-
 Namibia
-
 Nepal
Nepal
-
 Netherlands
-
 New Zealand
-
 Nigeria
-
 North Macedonia
-
 Norway
-
 Oman
Oman
-
 Pakistan
-
 Palestine
-
 Panama
-
 Papua New Guinea
-
 Paraguay
-
 Peru
Peru
-
 Philippines
-
 Poland
-
 Portugal
-
 Puerto Rico
-
 Qatar
Qatar
-
 Reunion
-
 Romania
-
 Rwanda
-
 Saudi Arabia
-
 Serbia
-
 Singapore
-
 Slovakia
-
 Slovenia
-
 Somalia
-
 South Africa
-
 Spain
Spain
-
 Sri Lanka
-
 Sweden
-
 Switzerland
-
 Syria
Syria
-
 Taiwan
-
 Tajikistan
-
 Tanzania
-
 Thailand
-
 Trinidad and Tobago
-
 Tunisia
-
 Turkey
-
 UAE
UAE
-
 Uganda
-
 Ukraine
-
 United Kingdom
-
United States
-
 Uruguay
-
 Uzbekistan
-
 Venezuela
-
 Vietnam
-
 Yemen
Yemen
-
 Zambia
-
 Zimbabwe
- Forex
- Crypto
