
XRP price prediction: Can ETF inflows spark a rebound? XRP under seller control

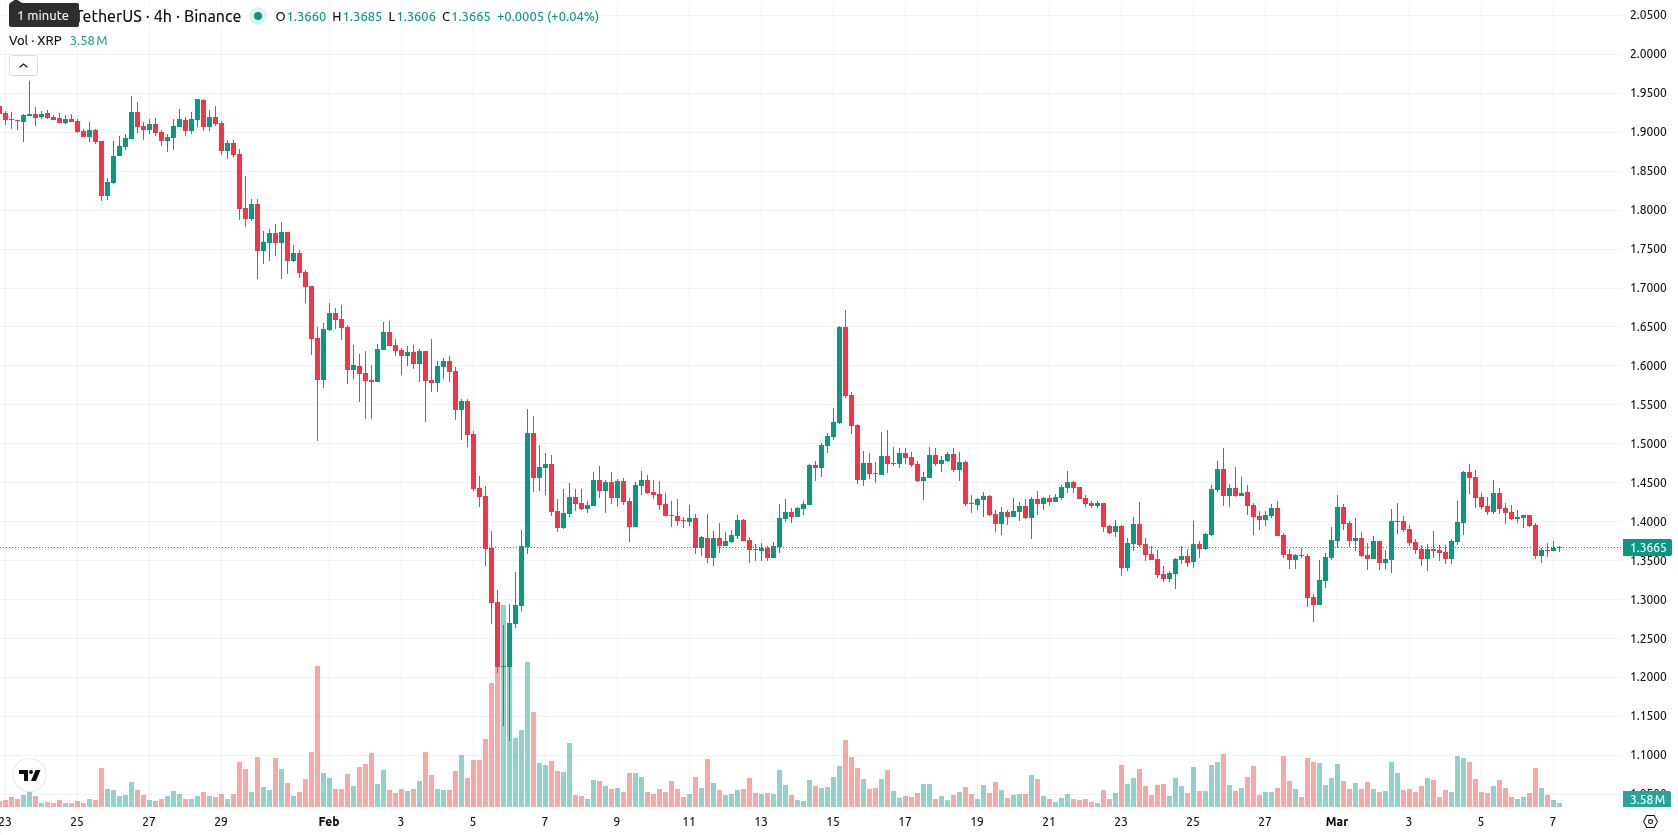
XRP (XRP) is trading at $1.367 after a daily decline of 2.2%. The price remains below the MA-20 ($1.4045), MA-50 ($1.5776), and MA-200 ($2.2247), confirming ongoing pressure from sellers relative to short-, medium-, and long-term moving averages.
 1.1083
1.1302
1.1083
1.1302
Highlights
- Amplify XRP 3% Monthly Premium Income ETF (XRPM) saw $955,752 in inflows, marking the largest in four weeks and signaling institutional engagement.
- Australia's regulatory approval for an XRP Ledger-based AUD digital token supports ongoing real-world blockchain use, despite continued market selling pressure.
- XRP trades below key moving averages with momentum indicators signaling a strong bearish trend, projecting a $1.10–$1.50 range and higher downside risk short term.
Institutional inflows rise while price lags under global regulatory moves
On February 26, 2026, the Amplify XRP 3% Monthly Premium Income ETF (XRPM), which offers exposure to XRP, recorded significant inflows totaling $955,752. Inflows into US-based XRP exchange-traded funds reached their highest level in four weeks, indicating institutional participation. Australia issued a regulatory license supporting use of the XRP Ledger for an Australian dollar digital token, accompanied by continued industry applications, though price action has remained under broader selling pressure.
Persistent bearish momentum as indicators reinforce resistance barriers
XRP’s persistent trading beneath the MA-20, MA-50, and MA-200 underscores sustained bearish pressure across all timeframes, with the Ichimoku Kijun at $1.4707 acting as immediate resistance. Technical indicators confirm negative momentum, as both MACD and ADX signal a strong bearish trend on the daily timeframe. The RSI stands at 42.54, the Commodity Channel Index (CCI) and Stochastic RSI show no signs of immediate oversold conditions and lean toward ongoing weakness, and Bull/Bear Power points to only mild buying attempts that are overwhelmed by seller control. With no gap between yesterday’s close and today’s open, the price has slipped 2.2% intraday and sits near the midpoint of today’s range, reflecting moderate intraday volatility. Divergence among short-term oscillators points to brief buying attempts, but overall, selling pressure dominates.
Sideways movement favored while bullish reversal odds remain low
For the week ahead, XRP is expected to fluctuate within a $1.10 to $1.50 volatility band relative to current levels, reflecting typical price swings. The likelihood of a meaningful price increase remains very low, estimated at under 20%, suggesting a greater probability of further downside. The baseline scenario expects sideways movement within this corridor under seller control. A bullish reversal would require a move and close above the immediate $1.47 resistance, while a bearish break below $1.10 would expose the asset to additional long-term and weekly technical weakness.
Last time, analysts noted that XRP’s price had rebounded from earlier weakness but remained in a cautious phase, struggling to confirm a stronger uptrend as it tests support near the $1.39-$1.40 area. Technicals indicate a neutral momentum with key resistance near $1.47, while policy uncertainty and macro conditions continue to influence traders’ willingness to sustain or extend the current rally.









-
 Afghanistan
-
 Albania
-
 Algeria
-
 Angola
-
 Argentina
-
 Armenia
-
 Australia
-
 Austria
-
 Azerbaijan
-
 Bahamas
-
 Bahrain
-
 Bangladesh
-
 Belarus
-
 Belgium
-
 Bolivia
-
 Botswana
-
 Brazil
-
 Brunei
-
 Bulgaria
-
 Cambodia
-
 Cameroon
-
 Canada
-
 Chile
Chile
-
 China
China
-
 Colombia
-
 Congo
Congo
-
 Costa Rica
-
 Cote d'Ivoire
-
 Croatia
-
 Cuba
Cuba
-
 Cyprus
-
 Czechia
-
 DR Congo
-
 Denmark
-
 Dominican Republic
-
 Ecuador
-
 Egypt
Egypt
-
 El Salvador
-
 Estonia
-
 Eswatini
-
 Ethiopia
-
 Finland
-
 France
-
 Georgia
-
 Germany
-
 Ghana
Ghana
-
 Greece
-
 Haiti
Haiti
-
 Hong Kong
-
 Hungary
-
 India
India
-
 Indonesia
-
 Iran, Islamic republic
-
 Iraq
Iraq
-
 Ireland
-
 Israel
-
 Italy
Italy
-
 Jamaica
-
 Japan
Japan
-
 Jordan
-
 Kazakhstan
-
 Kenya
Kenya
-
 Korea
Korea
-
 Kuwait
-
 Kyrgyzstan
-
 Laos
Laos
-
 Latvia
-
 Lebanon
-
 Lesotho
-
 Libya
Libya
-
 Lithuania
-
 Luxembourg
-
 Madagascar
-
 Malaysia
-
 Malta
Malta
-
 Mauritius
-
 Mexico
-
 Moldova
-
 Mongolia
-
 Montenegro
-
 Morocco
-
 Mozambique
-
 Myanmar
-
 Namibia
-
 Nepal
Nepal
-
 Netherlands
-
 New Zealand
-
 Nigeria
-
 North Macedonia
-
 Norway
-
 Oman
Oman
-
 Pakistan
-
 Palestine
-
 Panama
-
 Papua New Guinea
-
 Paraguay
-
 Peru
Peru
-
 Philippines
-
 Poland
-
 Portugal
-
 Puerto Rico
-
 Qatar
Qatar
-
 Reunion
-
 Romania
-
 Rwanda
-
 Saudi Arabia
-
 Serbia
-
 Singapore
-
 Slovakia
-
 Slovenia
-
 Somalia
-
 South Africa
-
 Spain
Spain
-
 Sri Lanka
-
 Sweden
-
 Switzerland
-
 Syria
Syria
-
 Taiwan
-
 Tajikistan
-
 Tanzania
-
 Thailand
-
 Trinidad and Tobago
-
 Tunisia
-
 Turkey
-
 UAE
UAE
-
 Uganda
-
 Ukraine
-
 United Kingdom
-
United States
-
 Uruguay
-
 Uzbekistan
-
 Venezuela
-
 Vietnam
-
 Yemen
Yemen
-
 Zambia
-
 Zimbabwe
- Forex
- Crypto











