
XRP price prediction: Is the slide over? XRP faces more downside risk

XRP (XRP) is trading at $1.3532 after slipping 1.02% today, currently positioned below the MA-20 ($1.3985), MA-50 ($1.5633), and MA-200 ($2.2172), which confirms sustained pressure from sellers across all key technical timeframes. The Ichimoku Kijun resistance stands at $1.4707, capping near-term upside attempts.
 1.1135
1.1302
1.1135
1.1302
Highlights
- XRP spot ETFs saw $16.62 million in net outflows on March 6, extending a two-day total to $22.77 million and signaling sustained institutional selling.
- The Depository Trust & Clearing Corporation published a patent for a cross-ledger liquidity framework naming XRP as a 'Digital Liquidity Token,' highlighting growing infrastructure interest.
- Technicals confirm bearish momentum as XRP trades below key resistance, with a one-week range likely between $1.22 and $1.48 amid continued downside pressure.
Record ETF outflows as institutional selling accelerates in March
On March 6, XRP spot ETFs reported $16.62 million in net outflows, following $6.15 million of outflows from the previous day, bringing the two-day total withdrawals to $22.77 million. This represented the largest ETF outflow for XRP in March and extended a sequence of institutional selling not seen since late February, with cumulative inflows remaining at $1.24 billion. The Depository Trust & Clearing Corporation published a patent for a cross-ledger liquidity framework identifying XRP as a 'Digital Liquidity Token.'
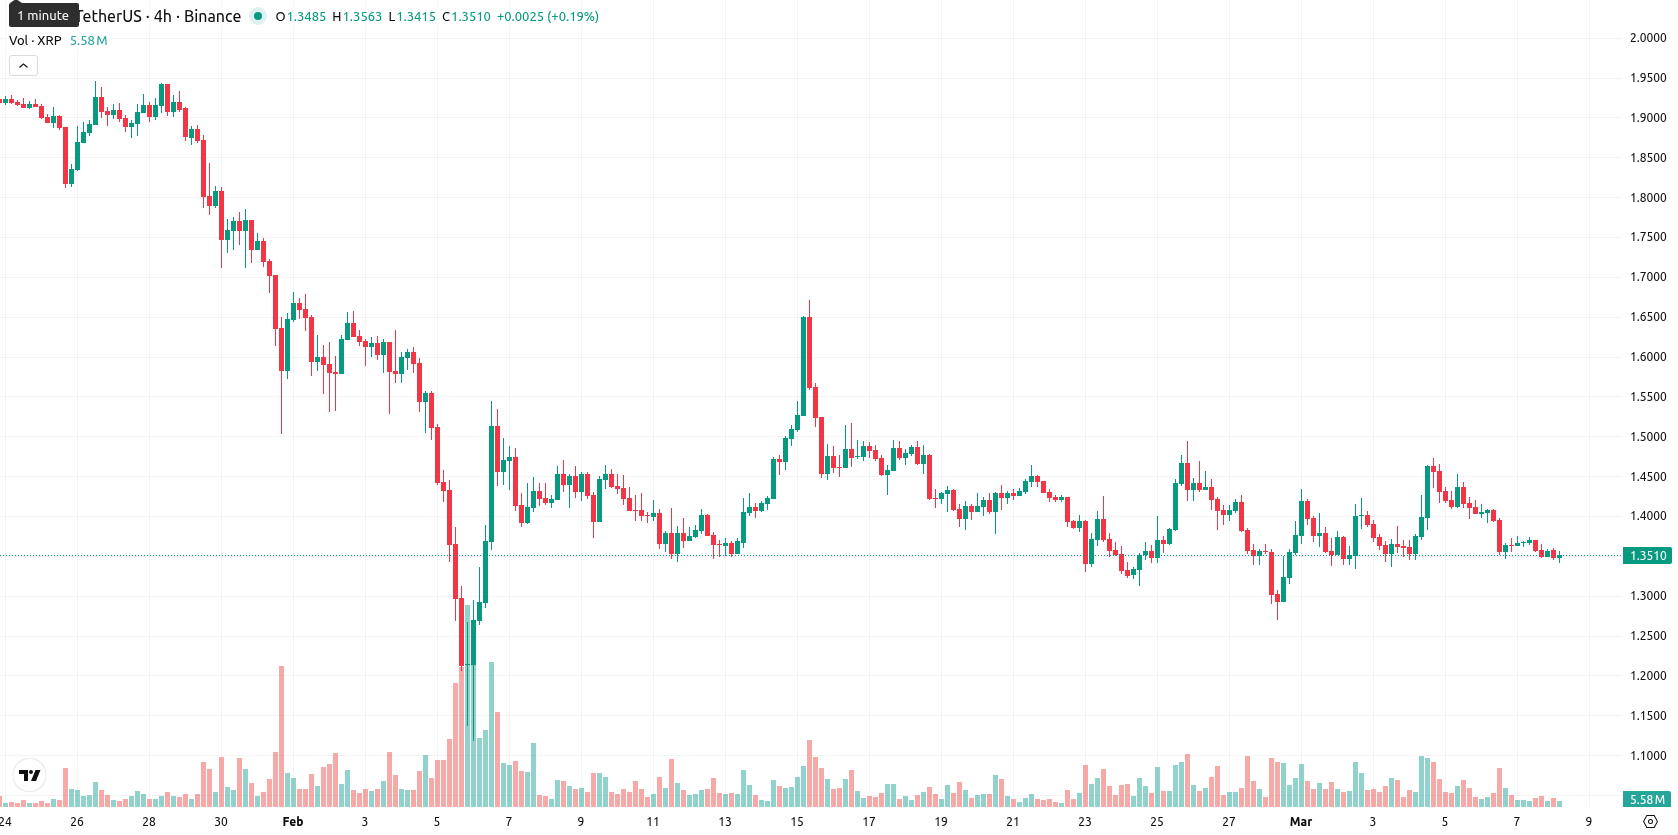
Bearish momentum prevails with technical indicators signaling divergence
Daily technicals confirm bearish momentum: XRP remains below the short-, medium-, and long-term moving averages (MA-20, MA-50, MA-200). The $1.4707 Ichimoku Kijun level now functions as immediate resistance. Strong sell signals persist on both the MACD and ADX. The RSI at 41.8, Stochastic RSI at a neutral mid-level, and CCI at -85.9 point to moderate downward pressure, while Bull/Bear Power readings remain negative. There is moderate intraday volatility, but no indication of extreme oversold or overbought conditions. Momentum and oscillator signals broadly align with the bearish daily trend, with the Awesome Oscillator neutral and the Stochastic RSI less directional, reflecting some divergence among short-term indicators.
Downside favored as technicals cap upside and volatility persists
Over the next week, XRP will likely trade within a typical volatility band relative to current levels, between $1.22 and $1.48. Technical indicators suggest that the probability of an upside move is low (under 20%), and further downside is more likely as selling pressure is confirmed by both daily and weekly signals. In a baseline scenario, consolidation is expected within the defined range, but a sustained move above $1.47 could trigger a push toward the upper boundary. A break below $1.22 may occur if bearish momentum intensifies.
Previously it was reported that XRP is maintaining a mild weekly rebound but remains constrained below its key moving averages, with persistent bearish technical signals—such as negative MACD, ADX, and oversold RSI—highlighting ongoing selling pressure. Support is seen at $1.23 and resistance at $1.50, with price action expected to remain range-bound in the near term amid heightened volatility and limited breakout potential.









-
 Afghanistan
-
 Albania
-
 Algeria
-
 Angola
-
 Argentina
-
 Armenia
-
 Australia
-
 Austria
-
 Azerbaijan
-
 Bahamas
-
 Bahrain
-
 Bangladesh
-
 Belarus
-
 Belgium
-
 Bolivia
-
 Botswana
-
 Brazil
-
 Brunei
-
 Bulgaria
-
 Cambodia
-
 Cameroon
-
 Canada
-
 Chile
Chile
-
 China
China
-
 Colombia
-
 Congo
Congo
-
 Costa Rica
-
 Cote d'Ivoire
-
 Croatia
-
 Cuba
Cuba
-
 Cyprus
-
 Czechia
-
 DR Congo
-
 Denmark
-
 Dominican Republic
-
 Ecuador
-
 Egypt
Egypt
-
 El Salvador
-
 Estonia
-
 Eswatini
-
 Ethiopia
-
 Finland
-
 France
-
 Georgia
-
 Germany
-
 Ghana
Ghana
-
 Greece
-
 Haiti
Haiti
-
 Hong Kong
-
 Hungary
-
 India
India
-
 Indonesia
-
 Iran, Islamic republic
-
 Iraq
Iraq
-
 Ireland
-
 Israel
-
 Italy
Italy
-
 Jamaica
-
 Japan
Japan
-
 Jordan
-
 Kazakhstan
-
 Kenya
Kenya
-
 Korea
Korea
-
 Kuwait
-
 Kyrgyzstan
-
 Laos
Laos
-
 Latvia
-
 Lebanon
-
 Lesotho
-
 Libya
Libya
-
 Lithuania
-
 Luxembourg
-
 Madagascar
-
 Malaysia
-
 Malta
Malta
-
 Mauritius
-
 Mexico
-
 Moldova
-
 Mongolia
-
 Montenegro
-
 Morocco
-
 Mozambique
-
 Myanmar
-
 Namibia
-
 Nepal
Nepal
-
 Netherlands
-
 New Zealand
-
 Nigeria
-
 North Macedonia
-
 Norway
-
 Oman
Oman
-
 Pakistan
-
 Palestine
-
 Panama
-
 Papua New Guinea
-
 Paraguay
-
 Peru
Peru
-
 Philippines
-
 Poland
-
 Portugal
-
 Puerto Rico
-
 Qatar
Qatar
-
 Reunion
-
 Romania
-
 Rwanda
-
 Saudi Arabia
-
 Serbia
-
 Singapore
-
 Slovakia
-
 Slovenia
-
 Somalia
-
 South Africa
-
 Spain
Spain
-
 Sri Lanka
-
 Sweden
-
 Switzerland
-
 Syria
Syria
-
 Taiwan
-
 Tajikistan
-
 Tanzania
-
 Thailand
-
 Trinidad and Tobago
-
 Tunisia
-
 Turkey
-
 UAE
UAE
-
 Uganda
-
 Ukraine
-
 United Kingdom
-
United States
-
 Uruguay
-
 Uzbekistan
-
 Venezuela
-
 Vietnam
-
 Yemen
Yemen
-
 Zambia
-
 Zimbabwe
- Forex
- Crypto











