
Ethereum price prediction: Can resistance at $2,120 hold? ETH posts 2.8% gain

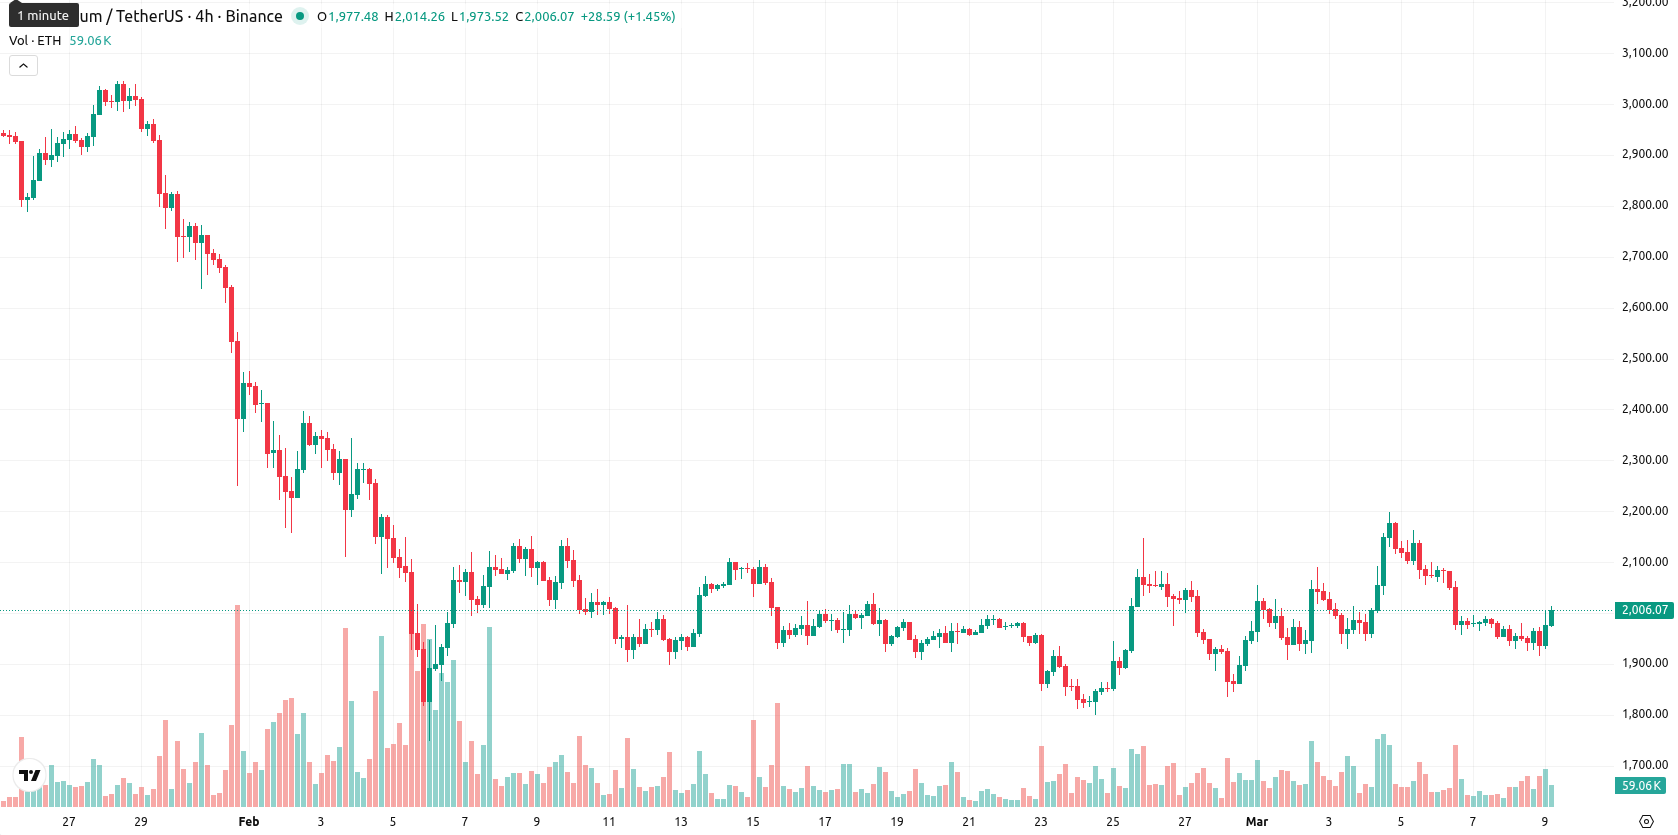
Ethereum (ETH) is trading at $2,006.08, above the MA-20 ($1,976.69) but well below both the MA-50 ($2,274.83) and MA-200 ($3,324.58). This positioning highlights short-term positive momentum, while medium- and long-term trends remain under pressure from sellers; immediate resistance is marked by the Ichimoku Kijun at $1,999.50.
Highlights
- Ethereum ETFs saw major outflows of $373.2 million on March 8, signaling increased institutional caution despite recent inflows.
- On-chain data reveals over 36 million ETH now staked, constraining liquid supply as large holders move assets off exchanges ahead of the Pectra upgrade.
- Technicals show price faces firm resistance at $1,999–$2,120 with a likely range of $1,850 to $2,120 over five days, as longer-term momentum remains bearish.
Institutional outflows and whale accumulation amid supply shift
On March 8, 2026, Ethereum ETFs recorded significant outflows totaling $373.2 million, including a $411.3 million withdrawal from the largest single fund, reflecting institutional caution. Earlier, on March 6, the iShares Ethereum Trust ETF (ETHA) saw a net inflow of $30.25 million, raising its assets under management to nearly $6.67 billion. On-chain data shows over 36 million ETH staked, reducing liquid supply, while large holders are moving coins off exchanges amid the upcoming Pectra network upgrade.
Bearish momentum and neutral oscillators signal mixed technical setup
Momentum signals are mixed: the MACD on the daily chart points to strong selling, and the ADX shows ongoing bearish strength, while the Awesome Oscillator supports recent upward movement. The daily RSI is 43.02 and CCI is neutral, both suggesting the market is neither overbought nor oversold; Bull/Bear Power indicates sellers still dominate despite today's advance. The Stochastic RSI sits in neutral territory overall, though it is overbought on intraday timeframes, highlighting oscillator divergence. Price action has shown moderate volatility with ETH trading close to today’s intraday high.
Low upside odds as resistance caps near-term price action
Over the next 5 trading days, typical volatility is expected between $1,850 and $2,120. With no major weekly buy signals across indicators, the probability of a price increase is considered very low (less than 20%), making a decline more likely. If the immediate resistance at the Ichimoku Kijun holds, ETH may oscillate sideways within this range. A decisive break above $2,035 – $2,120 could target higher resistance, while a fall below $1,850 would likely trigger renewed downside momentum.
Previously it was reported that Ethereum continues to face persistent bearish momentum, with the price trading below key moving averages and immediate resistance at the Ichimoku Kijun, while technical indicators such as MACD, ADX, and RSI reflect underlying weakness and sustained selling pressure. Near-term outlook remains sideways-to-lower absent a breakout above resistance, with sellers retaining control and volatility projected to stay moderate.


Latest Ethereum News


-
 Afghanistan
-
 Albania
-
 Algeria
-
 Angola
-
 Argentina
-
 Armenia
-
 Australia
-
 Austria
-
 Azerbaijan
-
 Bahamas
-
 Bahrain
-
 Bangladesh
-
 Belarus
-
 Belgium
-
 Bolivia
-
 Botswana
-
 Brazil
-
 Brunei
-
 Bulgaria
-
 Cambodia
-
 Cameroon
-
 Canada
-
 Chile
Chile
-
 China
China
-
 Colombia
-
 Congo
Congo
-
 Costa Rica
-
 Cote d'Ivoire
-
 Croatia
-
 Cuba
Cuba
-
 Cyprus
-
 Czechia
-
 DR Congo
-
 Denmark
-
 Dominican Republic
-
 Ecuador
-
 Egypt
Egypt
-
 El Salvador
-
 Estonia
-
 Eswatini
-
 Ethiopia
-
 Finland
-
 France
-
 Georgia
-
 Germany
-
 Ghana
Ghana
-
 Greece
-
 Haiti
Haiti
-
 Hong Kong
-
 Hungary
-
 India
India
-
 Indonesia
-
 Iran, Islamic republic
-
 Iraq
Iraq
-
 Ireland
-
 Israel
-
 Italy
Italy
-
 Jamaica
-
 Japan
Japan
-
 Jordan
-
 Kazakhstan
-
 Kenya
Kenya
-
 Korea
Korea
-
 Kuwait
-
 Kyrgyzstan
-
 Laos
Laos
-
 Latvia
-
 Lebanon
-
 Lesotho
-
 Libya
Libya
-
 Lithuania
-
 Luxembourg
-
 Madagascar
-
 Malaysia
-
 Malta
Malta
-
 Mauritius
-
 Mexico
-
 Moldova
-
 Mongolia
-
 Montenegro
-
 Morocco
-
 Mozambique
-
 Myanmar
-
 Namibia
-
 Nepal
Nepal
-
 Netherlands
-
 New Zealand
-
 Nigeria
-
 North Macedonia
-
 Norway
-
 Oman
Oman
-
 Pakistan
-
 Palestine
-
 Panama
-
 Papua New Guinea
-
 Paraguay
-
 Peru
Peru
-
 Philippines
-
 Poland
-
 Portugal
-
 Puerto Rico
-
 Qatar
Qatar
-
 Reunion
-
 Romania
-
 Rwanda
-
 Saudi Arabia
-
 Serbia
-
 Singapore
-
 Slovakia
-
 Slovenia
-
 Somalia
-
 South Africa
-
 Spain
Spain
-
 Sri Lanka
-
 Sweden
-
 Switzerland
-
 Syria
Syria
-
 Taiwan
-
 Tajikistan
-
 Tanzania
-
 Thailand
-
 Trinidad and Tobago
-
 Tunisia
-
 Turkey
-
 UAE
UAE
-
 Uganda
-
 Ukraine
-
 United Kingdom
-
United States
-
 Uruguay
-
 Uzbekistan
-
 Venezuela
-
 Vietnam
-
 Yemen
Yemen
-
 Zambia
-
 Zimbabwe
- Forex
- Crypto
