
Ethereum: Complex Iran sanctions and CPI data drive bullish momentum

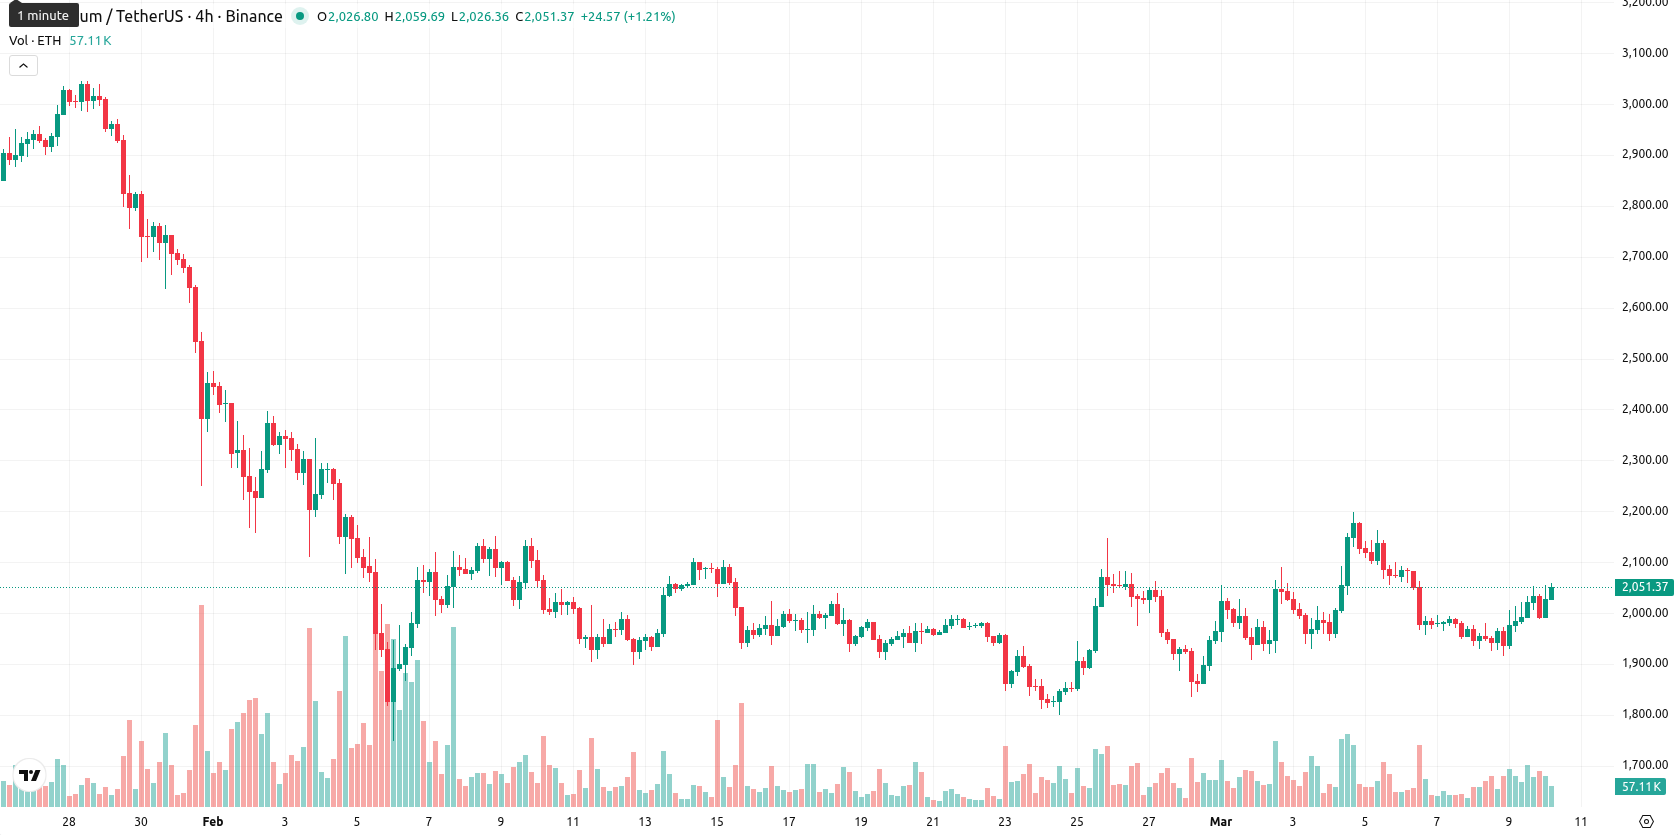
Ethereum (ETH) is trading at $2,051.05, up 3.60% for the day. The price sits above its MA-20 of $1,976.33, indicating short-term bullish momentum, but remains below its MA-50 at $2,248.84 and MA-200 at $3,313.38, highlighting a generally bearish medium- and long-term trend.
Highlights
- Escalating Middle East tensions and evolving sanctions regimes are heightening volatility and generating legal uncertainty for Ethereum’s global institutional flows.
- U.S. inflation data and Federal Reserve policy decisions could restrict Ethereum liquidity if inflation remains sticky or rate cuts are delayed.
- Technicals indicate Ethereum trades within a short-term rally but faces persistent bearish pressure, with a likely range of $1,800 to $2,250 this week.
Institutional access faces uncertainty amid sanctions and macro volatility
On Monday, heightened geopolitical tension in the Middle East, particularly involving Iran, has increased macroeconomic volatility and led to a risk-off environment across global markets, including Ethereum trading. Sanctions regimes have become more complex and fast-moving in recent years, as highlighted by the surge in sanctioned securities and compliance risks since early 2022, increasing legal uncertainties for Ethereum’s institutional access and international flows. The evolving use of economic sanctions, especially by major states, is directly impacting the regulatory and geo-economic landscape, potentially restricting cross-border transactions and access to fiat on/off ramps for Ethereum. Additionally, upcoming U.S. macro data such as CPI (inflation) reports and Federal Reserve policy decisions are positioned to influence capital flows and risk appetite in crypto markets, as persistent inflation or delayed interest rate cuts would diminish liquidity for Ethereum.
Mixed momentum as technical resistance caps unstable rally
Technically, ETH is holding above its MA-20 ($1,976.33) but remains capped by the MA-50 ($2,248.84) and MA-200 ($3,313.38), reflecting a short-term bullish move within a broader bearish structure. The Ichimoku Kijun level at $1,999.50 provides immediate support. Momentum signals are mixed: MACD and ADX remain bearish, yet Stochastic RSI and Bull/Bear Power indicate strong buying and overbought conditions, while RSI and CCI are neutral to slightly weak. Elevated intraday volatility and price action near the session high suggest that buyers have near-term control, yet conflicting oscillator readings point to an unstable rally.
Limited upside potential as bearish signals dominate week ahead
For the coming week, ETH is likely to trade within a volatility band of $1,800 to $2,250, in line with typical price fluctuations relative to current levels and the prevailing trend. The probability of further upside is low, with less than a 20% chance of a breakout, given the dominant bearish signals from weekly moving averages, RSI, and MACD. The baseline scenario anticipates continued sideways activity between $1,800 and $2,250, with a bullish breakout needing a sustained push above $2,250, while a drop below $1,800 could trigger further downside risk.
Previously it was reported that Ethereum is trading above its short-term moving average but remains below key longer-term resistance levels, indicating mixed momentum. Momentum indicators are conflicted—with daily MACD and ADX signaling bearish pressure while Stochastic RSI flashes a buy—suggesting the asset is likely to trade sideways within established support and resistance bands, with downside risk prevailing in the near term.


Latest Ethereum News


-
 Afghanistan
-
 Albania
-
 Algeria
-
 Angola
-
 Argentina
-
 Armenia
-
 Australia
-
 Austria
-
 Azerbaijan
-
 Bahamas
-
 Bahrain
-
 Bangladesh
-
 Belarus
-
 Belgium
-
 Bolivia
-
 Botswana
-
 Brazil
-
 Brunei
-
 Bulgaria
-
 Cambodia
-
 Cameroon
-
 Canada
-
 Chile
Chile
-
 China
China
-
 Colombia
-
 Congo
Congo
-
 Costa Rica
-
 Cote d'Ivoire
-
 Croatia
-
 Cuba
Cuba
-
 Cyprus
-
 Czechia
-
 DR Congo
-
 Denmark
-
 Dominican Republic
-
 Ecuador
-
 Egypt
Egypt
-
 El Salvador
-
 Estonia
-
 Eswatini
-
 Ethiopia
-
 Finland
-
 France
-
 Georgia
-
 Germany
-
 Ghana
Ghana
-
 Greece
-
 Haiti
Haiti
-
 Hong Kong
-
 Hungary
-
 India
India
-
 Indonesia
-
 Iran, Islamic republic
-
 Iraq
Iraq
-
 Ireland
-
 Israel
-
 Italy
Italy
-
 Jamaica
-
 Japan
Japan
-
 Jordan
-
 Kazakhstan
-
 Kenya
Kenya
-
 Korea
Korea
-
 Kuwait
-
 Kyrgyzstan
-
 Laos
Laos
-
 Latvia
-
 Lebanon
-
 Lesotho
-
 Libya
Libya
-
 Lithuania
-
 Luxembourg
-
 Madagascar
-
 Malaysia
-
 Malta
Malta
-
 Mauritius
-
 Mexico
-
 Moldova
-
 Mongolia
-
 Montenegro
-
 Morocco
-
 Mozambique
-
 Myanmar
-
 Namibia
-
 Nepal
Nepal
-
 Netherlands
-
 New Zealand
-
 Nigeria
-
 North Macedonia
-
 Norway
-
 Oman
Oman
-
 Pakistan
-
 Palestine
-
 Panama
-
 Papua New Guinea
-
 Paraguay
-
 Peru
Peru
-
 Philippines
-
 Poland
-
 Portugal
-
 Puerto Rico
-
 Qatar
Qatar
-
 Reunion
-
 Romania
-
 Rwanda
-
 Saudi Arabia
-
 Serbia
-
 Singapore
-
 Slovakia
-
 Slovenia
-
 Somalia
-
 South Africa
-
 Spain
Spain
-
 Sri Lanka
-
 Sweden
-
 Switzerland
-
 Syria
Syria
-
 Taiwan
-
 Tajikistan
-
 Tanzania
-
 Thailand
-
 Trinidad and Tobago
-
 Tunisia
-
 Turkey
-
 UAE
UAE
-
 Uganda
-
 Ukraine
-
 United Kingdom
-
United States
-
 Uruguay
-
 Uzbekistan
-
 Venezuela
-
 Vietnam
-
 Yemen
Yemen
-
 Zambia
-
 Zimbabwe
- Forex
- Crypto
