

Render surges 11.32% with support holding at $1.35 – weekly review

Render (RENDER) is currently trading at $1.503, which is below both the weekly MA-20 at $1.7043 and MA-50 at $2.9207, indicating persistent selling pressure and no clear long-term support in sight. Over the past week, the asset rebounded 11.32% from its low, closing near the weekly high, though it remains beneath major weekly moving averages that act as resistance.
 1.447
1.6400
Highlights
- RNDR trades below major moving averages, indicating sustained bearish momentum and absence of longer-term technical support.
- Key weekly momentum indicators confirm sellers remain in control, with no strong signals of a reversal developing.
- Price is likely to remain rangebound between $1.35 and $1.65 over the next week, with further declines statistically favored.
Rising AI infrastructure demand fuels renewed project momentum this week
Render has facilitated renewed interest by supporting a global marketplace for artists and developers to access GPU rendering resources from idle compute power owners. The platform now processes millions of frames and fosters a growing community focused on Web3 and AI-driven creative projects. Recent activity has been influenced by increased demand for its AI GPU infrastructure.
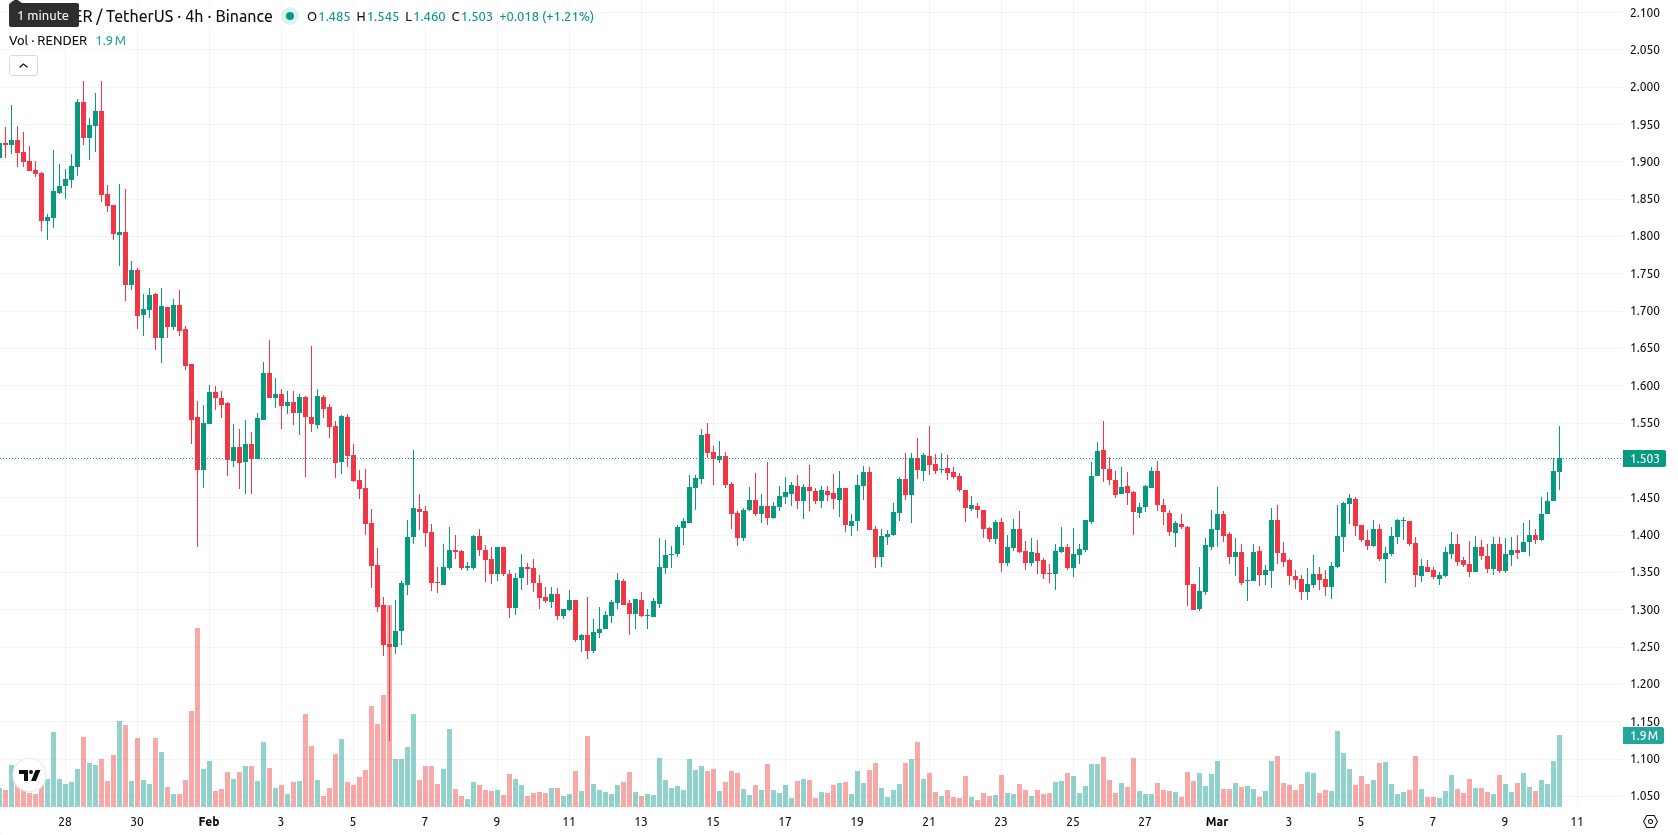
Bearish momentum persists over the week with only tentative reversal signals
Weekly technical indicators highlight continued bearish momentum. The price remains under pressure below both the weekly MA-20 and MA-50, and the Ichimoku Kijun level is not immediately relevant. On the weekly chart, momentum remains bearish according to the MACD (strong sell) and ADX (sell), with the RSI, CCI, and Bull/Bear Power also in bearish territory, all indicating a lack of clear bullish reversal signals. The Stochastic RSI displays a buy signal, but this is contradicted by persistent weakness in other momentum readings. Support is seen near $1.35, while resistance aligns with the MA-20 at $1.7043.
Sideways trading expected next week amid weak bullish catalysts
For the next 5 to 7 trading days, Render is likely to trade in a sideways range between $1.35 and $1.65, reflecting recent weekly volatility. The probability of a further move higher is low, with zero out of four key weekly momentum indicators showing a true buy signal, making further declines statistically more likely. The base case is for sideways movement near $1.50, while a break above $1.65 would require strong renewed buying interest. A break below $1.35 would reinforce the prevailing bearish trend.
Last time, analysts noted that Render is exhibiting a short-term recovery but remains in a broader bearish trend, with price above the 20-day moving average but below the 50- and 200-day averages. Technical indicators are mixed—MACD and RSI lean bearish, momentum is weak, and a neutral ADX and overbought Stoch RSI signal limited upside, with support at $1.4085 and a likely trading range between $1.36 and $1.58 unless key levels are breached.










-
 Afghanistan
-
 Albania
-
 Algeria
-
 Angola
-
 Argentina
-
 Armenia
-
 Australia
-
 Austria
-
 Azerbaijan
-
 Bahamas
-
 Bahrain
-
 Bangladesh
-
 Belarus
-
 Belgium
-
 Bolivia
-
 Botswana
-
 Brazil
-
 Brunei
-
 Bulgaria
-
 Cambodia
-
 Cameroon
-
 Canada
-
 Chile
-
 China
-
 Colombia
-
 Congo
-
 Costa Rica
-
 Cote d'Ivoire
-
 Croatia
-
 Cuba
-
 Cyprus
-
 Czechia
-
 DR Congo
-
 Denmark
-
 Dominican Republic
-
 Ecuador
-
 Egypt
-
 El Salvador
-
 Estonia
-
 Eswatini
-
 Ethiopia
-
 Finland
-
 France
-
 Georgia
-
 Germany
-
 Ghana
-
 Greece
-
 Haiti
-
 Hong Kong
-
 Hungary
-
 India
-
 Indonesia
-
 Iran, Islamic republic
-
 Iraq
-
 Ireland
-
 Israel
-
 Italy
-
 Jamaica
-
 Japan
-
 Jordan
-
 Kazakhstan
-
 Kenya
-
 Korea
-
 Kuwait
-
 Kyrgyzstan
-
 Laos
-
 Latvia
-
 Lebanon
-
 Lesotho
-
 Libya
-
 Lithuania
-
 Luxembourg
-
 Madagascar
-
 Malaysia
-
 Malta
-
 Mauritius
-
 Mexico
-
 Moldova
-
 Mongolia
-
 Montenegro
-
 Morocco
-
 Mozambique
-
 Myanmar
-
 Namibia
-
 Nepal
-
 Netherlands
-
 New Zealand
-
 Nigeria
-
 North Macedonia
-
 Norway
-
 Oman
-
 Pakistan
-
 Palestine
-
 Panama
-
 Papua New Guinea
-
 Paraguay
-
 Peru
-
 Philippines
-
 Poland
-
 Portugal
-
 Puerto Rico
-
 Qatar
-
 Reunion
-
 Romania
-
 Rwanda
-
 Saudi Arabia
-
 Serbia
-
 Singapore
-
 Slovakia
-
 Slovenia
-
 Somalia
-
 South Africa
-
 Spain
-
 Sri Lanka
-
 Sweden
-
 Switzerland
-
 Syria
-
 Taiwan
-
 Tajikistan
-
 Tanzania
-
 Thailand
-
 Trinidad and Tobago
-
 Tunisia
-
 Turkey
-
 UAE
-
 Uganda
-
 Ukraine
-
 United Kingdom
-
United States
-
 Uruguay
-
 Uzbekistan
-
 Venezuela
-
 Vietnam
-
 Yemen
-
 Zambia
-
 Zimbabwe
- Forex
- Crypto












