
+7.57% for Sei — Overbought momentum lacks broad support

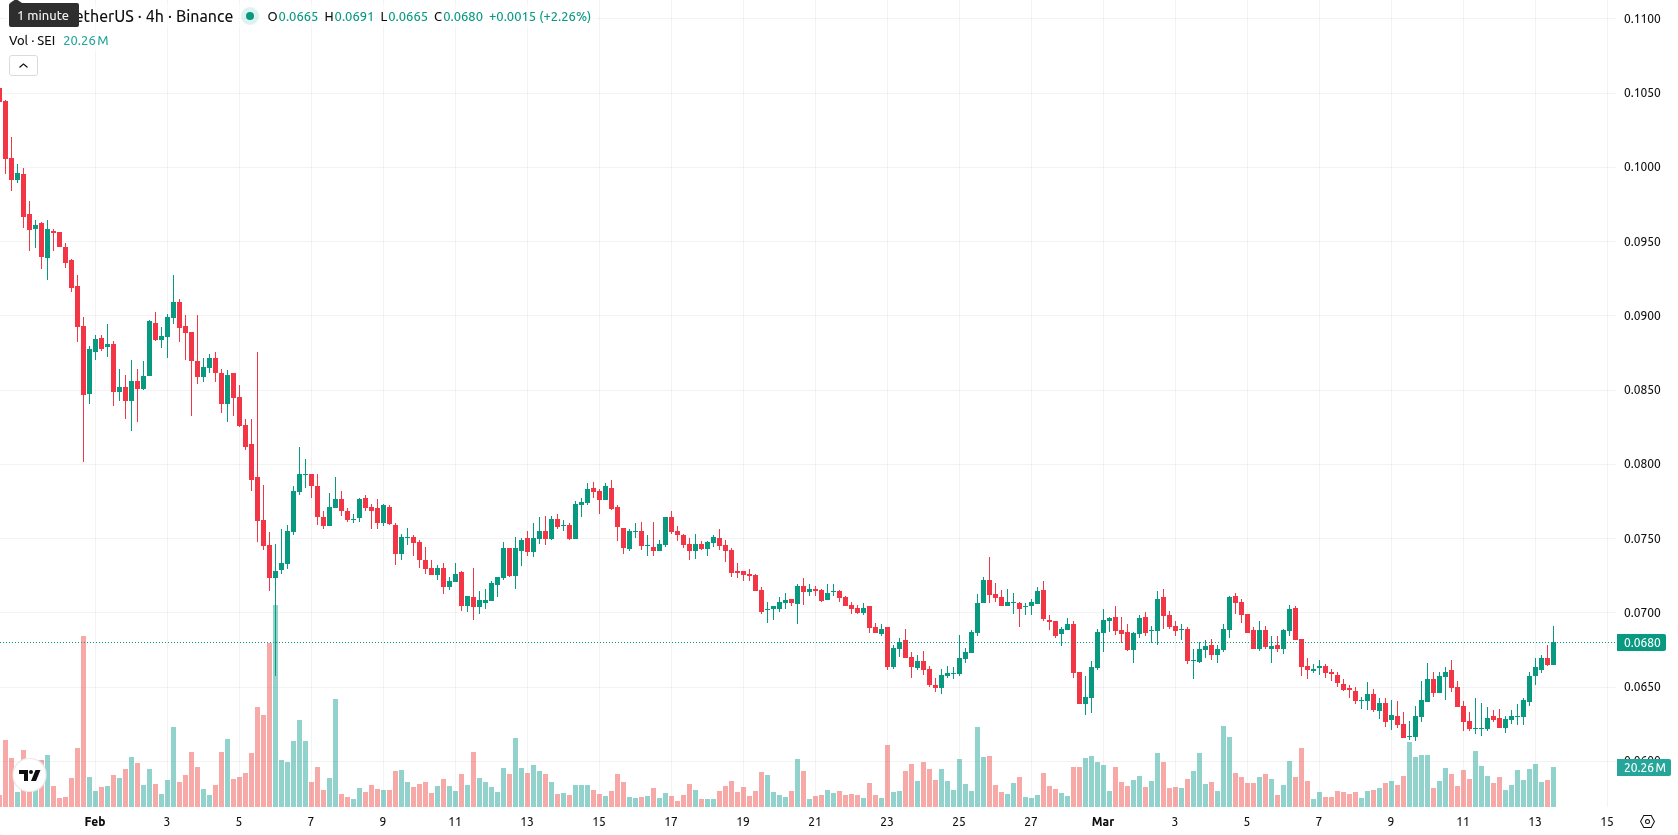
Sei (SEI) is trading at $0.0682, reflecting a daily gain of 7.57%. The asset is positioned just above its 20-day moving average of $0.0672 but remains well below both the MA-50 at $0.0781 and MA-200 at $0.1656, showing short-term stabilization within an ongoing bearish medium- and long-term trend. The Ichimoku Kijun level, currently at $0.0701, acts as immediate resistance above the market price.
Highlights
- SEI is consolidating above short-term support but remains under persistent medium- and long-term bearish pressure.
- Mixed momentum signals and overbought short-term oscillators suggest the recent price rally lacks underlying strength and broad market support.
- Expected five-day range is $0.0620–$0.0720, with downside risk prevailing unless a sustained break above $0.0701 occurs.
Bearish bias persists as mixed momentum signals dampen rally
Momentum signals remain mixed: the daily MACD and ADX indicate a sell bias with weak trend strength, while the RSI is bearish near 40. The Stoch RSI is overbought and the CCI also signals a sell, suggesting today's rally is stretched and lacks broad confirmation. Bull/Bear Power (BBP) is negative, highlighting seller dominance despite the price surge. After a small gap up at the open, SEI is trading just above the intraday high within a narrow range, pointing to low volatility and some late-session strength but no clear breakout.
Limited upside seen as weak structure curbs breakout odds
Over the next five trading days, SEI is expected to trade between $0.0620 and $0.0720 — a typical volatility band relative to current levels. The probability of a further price increase is very low (less than 20%), with sideways action projected as short-term buying momentum fades. A move above $0.0701 would signal a bullish breakout, while trading below $0.0620 would expose the asset to renewed downside. Technical indicators across daily and weekly timeframes continue to favor a cautious approach as the long-term structure remains weak.
Previously it was reported that Sei is experiencing persistent selling pressure, trading below all major moving averages with technical indicators such as MACD and ADX confirming strong bearish momentum, while RSI and CCI show oversold conditions that limit immediate downside. Immediate resistance is at the Ichimoku Kijun, with the price expected to trade sideways within a defined range unless this level is breached, in which case a rebound toward upper resistance could develop.


-
 Afghanistan
-
 Albania
-
 Algeria
-
 Angola
-
 Argentina
-
 Armenia
-
 Australia
-
 Austria
-
 Azerbaijan
-
 Bahamas
-
 Bahrain
-
 Bangladesh
-
 Belarus
-
 Belgium
-
 Bolivia
-
 Botswana
-
 Brazil
-
 Brunei
-
 Bulgaria
-
 Cambodia
-
 Cameroon
-
 Canada
-
 Chile
Chile
-
 China
China
-
 Colombia
-
 Congo
Congo
-
 Costa Rica
-
 Cote d'Ivoire
-
 Croatia
-
 Cuba
Cuba
-
 Cyprus
-
 Czechia
-
 DR Congo
-
 Denmark
-
 Dominican Republic
-
 Ecuador
-
 Egypt
Egypt
-
 El Salvador
-
 Estonia
-
 Eswatini
-
 Ethiopia
-
 Finland
-
 France
-
 Georgia
-
 Germany
-
 Ghana
Ghana
-
 Greece
-
 Haiti
Haiti
-
 Hong Kong
-
 Hungary
-
 India
India
-
 Indonesia
-
 Iran, Islamic republic
-
 Iraq
Iraq
-
 Ireland
-
 Israel
-
 Italy
Italy
-
 Jamaica
-
 Japan
Japan
-
 Jordan
-
 Kazakhstan
-
 Kenya
Kenya
-
 Korea
Korea
-
 Kuwait
-
 Kyrgyzstan
-
 Laos
Laos
-
 Latvia
-
 Lebanon
-
 Lesotho
-
 Libya
Libya
-
 Lithuania
-
 Luxembourg
-
 Madagascar
-
 Malaysia
-
 Malta
Malta
-
 Mauritius
-
 Mexico
-
 Moldova
-
 Mongolia
-
 Montenegro
-
 Morocco
-
 Mozambique
-
 Myanmar
-
 Namibia
-
 Nepal
Nepal
-
 Netherlands
-
 New Zealand
-
 Nigeria
-
 North Macedonia
-
 Norway
-
 Oman
Oman
-
 Pakistan
-
 Palestine
-
 Panama
-
 Papua New Guinea
-
 Paraguay
-
 Peru
Peru
-
 Philippines
-
 Poland
-
 Portugal
-
 Puerto Rico
-
 Qatar
Qatar
-
 Reunion
-
 Romania
-
 Rwanda
-
 Saudi Arabia
-
 Serbia
-
 Singapore
-
 Slovakia
-
 Slovenia
-
 Somalia
-
 South Africa
-
 Spain
Spain
-
 Sri Lanka
-
 Sweden
-
 Switzerland
-
 Syria
Syria
-
 Taiwan
-
 Tajikistan
-
 Tanzania
-
 Thailand
-
 Trinidad and Tobago
-
 Tunisia
-
 Turkey
-
 UAE
UAE
-
 Uganda
-
 Ukraine
-
 United Kingdom
-
United States
-
 Uruguay
-
 Uzbekistan
-
 Venezuela
-
 Vietnam
-
 Yemen
Yemen
-
 Zambia
-
 Zimbabwe
- Forex
- Crypto
