
Bonk falls 7.40% as bearish signals highlight downside risk

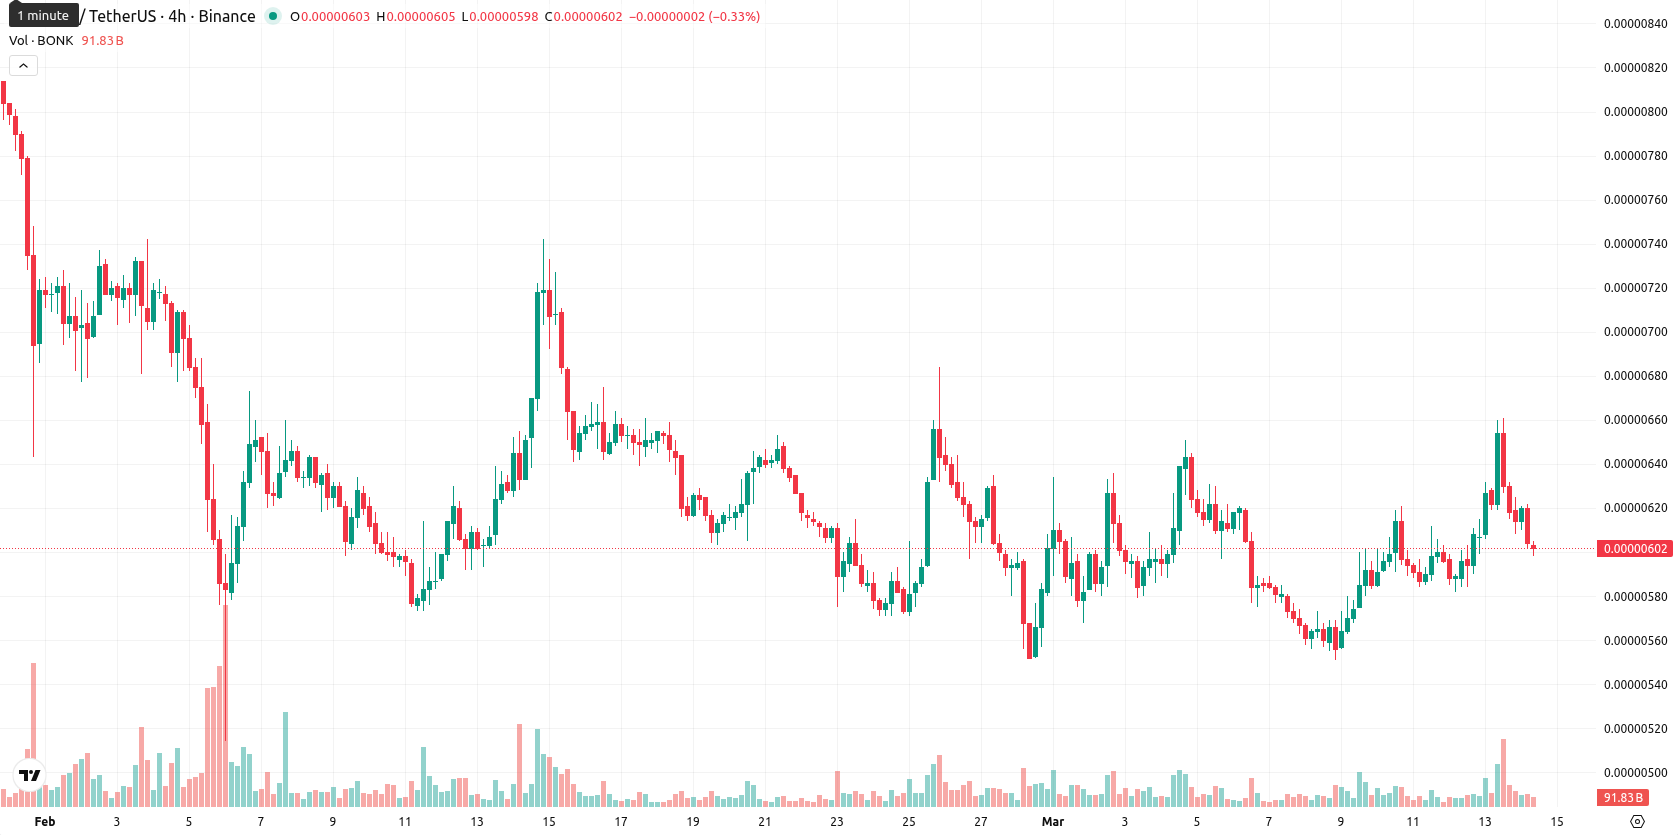
Bonk (BONK) is trading at $0.0000060, recording a daily decline of 7.40%. The asset stands just above its SMA-20 ($0.00000597), but it remains well below the SMA-50 ($0.00000662) and SMA-200 ($0.00001225), showing a neutral-to-bearish bias in the near term and sustained pressure from sellers in the medium and long term.
Highlights
- BONK maintains a sideways pattern near recent lows, facing ongoing medium-term selling pressure and weak long-term support.
- Momentum and oscillator signals are mixed to bearish, pointing to possible short-term pullback or prolonged consolidation.
- Price is expected to remain in a narrow $0.00000587–$0.00000646 range next week, with downside risk outweighing bullish breakout potential.
Mixed signals emerge as overbought oscillators meet weak trend
The technical setup for BONK shows immediate resistance at the Ichimoku Kijun ($0.00000617). MACD signals strong sell while the ADX is neutral, implying a lack of clear trend strength. Oscillator readings are mixed: RSI tilts slightly bearish, CCI indicates overbought conditions, and Stoch RSI sits at its extreme overbought value, all pointing to a potential short-term pullback. The Bull/Bear Power (BBP) remains positive and buyers have a slight intraday advantage, but the Awesome Oscillator is neutral and does not confirm a downtrend; price action reflects low volatility and persistent pressure at the day’s low.
Downside risk elevated as resistance caps bounce potential
In the short term, BONK is expected to trade within a volatility band between $0.00000587 and $0.00000646. The likelihood of a price increase is low (less than 20%), making further downside more probable. Baseline scenario sees sideways movement near recent lows, with a potential bullish move triggered only by a break above resistance at $0.00000617 toward $0.00000646. If the price falls below $0.00000587, further downside momentum could develop.
Bonk was experiencing short-term bullish momentum but faced ongoing bearish pressure from technical indicators and broader trend signals. The latest price action and oscillator data reinforce this cautious outlook, with traders advised to monitor the $0.00000617 resistance as a potential pivot point for a shift in momentum.


Latest Bonk News


-
 Afghanistan
-
 Albania
-
 Algeria
-
 Angola
-
 Argentina
-
 Armenia
-
 Australia
-
 Austria
-
 Azerbaijan
-
 Bahamas
-
 Bahrain
-
 Bangladesh
-
 Belarus
-
 Belgium
-
 Bolivia
-
 Botswana
-
 Brazil
-
 Brunei
-
 Bulgaria
-
 Cambodia
-
 Cameroon
-
 Canada
-
 Chile
Chile
-
 China
China
-
 Colombia
-
 Congo
Congo
-
 Costa Rica
-
 Cote d'Ivoire
-
 Croatia
-
 Cuba
Cuba
-
 Cyprus
-
 Czechia
-
 DR Congo
-
 Denmark
-
 Dominican Republic
-
 Ecuador
-
 Egypt
Egypt
-
 El Salvador
-
 Estonia
-
 Eswatini
-
 Ethiopia
-
 Finland
-
 France
-
 Georgia
-
 Germany
-
 Ghana
Ghana
-
 Greece
-
 Haiti
Haiti
-
 Hong Kong
-
 Hungary
-
 India
India
-
 Indonesia
-
 Iran, Islamic republic
-
 Iraq
Iraq
-
 Ireland
-
 Israel
-
 Italy
Italy
-
 Jamaica
-
 Japan
Japan
-
 Jordan
-
 Kazakhstan
-
 Kenya
Kenya
-
 Korea
Korea
-
 Kuwait
-
 Kyrgyzstan
-
 Laos
Laos
-
 Latvia
-
 Lebanon
-
 Lesotho
-
 Libya
Libya
-
 Lithuania
-
 Luxembourg
-
 Madagascar
-
 Malaysia
-
 Malta
Malta
-
 Mauritius
-
 Mexico
-
 Moldova
-
 Mongolia
-
 Montenegro
-
 Morocco
-
 Mozambique
-
 Myanmar
-
 Namibia
-
 Nepal
Nepal
-
 Netherlands
-
 New Zealand
-
 Nigeria
-
 North Macedonia
-
 Norway
-
 Oman
Oman
-
 Pakistan
-
 Palestine
-
 Panama
-
 Papua New Guinea
-
 Paraguay
-
 Peru
Peru
-
 Philippines
-
 Poland
-
 Portugal
-
 Puerto Rico
-
 Qatar
Qatar
-
 Reunion
-
 Romania
-
 Rwanda
-
 Saudi Arabia
-
 Serbia
-
 Singapore
-
 Slovakia
-
 Slovenia
-
 Somalia
-
 South Africa
-
 Spain
Spain
-
 Sri Lanka
-
 Sweden
-
 Switzerland
-
 Syria
Syria
-
 Taiwan
-
 Tajikistan
-
 Tanzania
-
 Thailand
-
 Trinidad and Tobago
-
 Tunisia
-
 Turkey
-
 UAE
UAE
-
 Uganda
-
 Ukraine
-
 United Kingdom
-
United States
-
 Uruguay
-
 Uzbekistan
-
 Venezuela
-
 Vietnam
-
 Yemen
Yemen
-
 Zambia
-
 Zimbabwe
- Forex
- Crypto
