

-7.03% for Kava as downside risk prevails below SMA-200

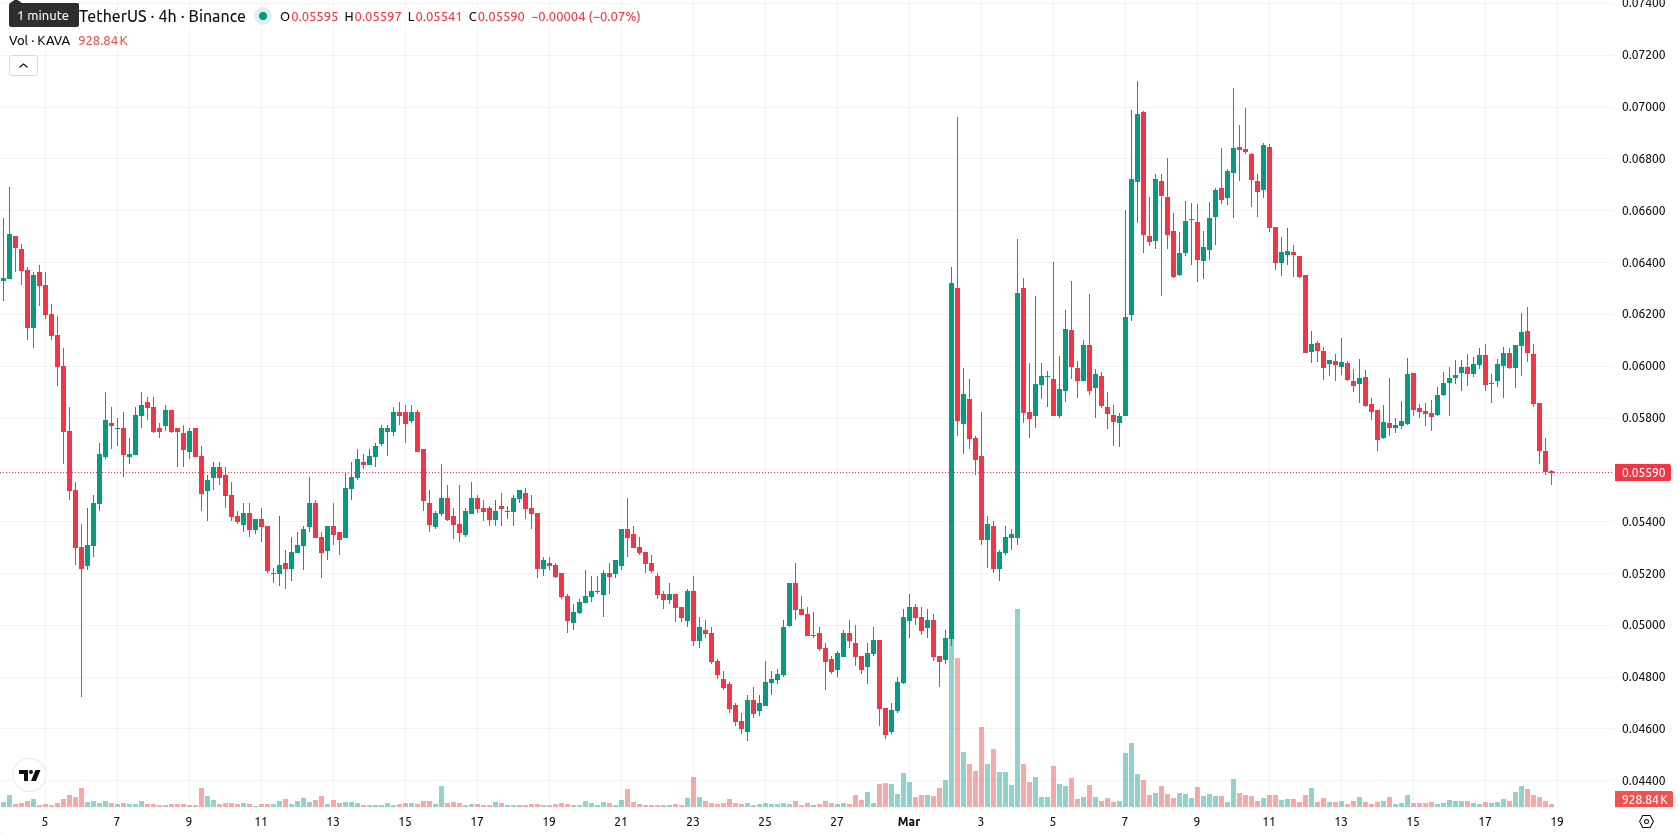
Kava (KAVA) is trading at $0.0556 after a 7.03% decline today, positioning the price below both the SMA-20 ($0.0587) and SMA-50 ($0.0582), and significantly beneath the SMA-200 ($0.1467). This reflects sustained bearish momentum in short, medium, and long-term trends with Kava now sitting near the low end of today's range.
 0.0683
0.0697
0.0683
0.0697
Highlights
- KAVA is in a persistent long-term downtrend, trading beneath key short- and long-term moving averages.
- Price volatility is high, with daily action dominated by sellers and momentum signals sending mixed near-term cues.
- Expected range for the next five days is $0.0541 to $0.0605, with over 80% probability of further decline unless $0.0583 resistance breaks.
Immediate selling pressure persists amid mixed momentum signals
Kava exhibits pronounced downside pressure as the current price is under all key moving averages, with the Ichimoku Kijun level on D1 at $0.0583 acting as immediate resistance. Momentum signals are mixed: the daily MACD gives a strong buy signal and ADX shows buyers retain some control, but BBP indicates strong intraday seller dominance. RSI is slightly above neutral at 51.5, Stoch RSI is deeply oversold, and CCI and AO are both neutral. The session saw steep intraday volatility within a $0.0558 to $0.0623 range, as mid-term bullish divergence is present but immediate selling continues to dominate.
Downside risk elevated as price faces volatility and weak support
Over the next five trading days, KAVA is likely to move within a volatility band between $0.0541 and $0.0605. The probability of continued price decline is above 80%, with all weekly indicators signaling persistent downside risk. The baseline scenario is for the price to hover in a sideways corridor just above support. A breakout above $0.0583 would indicate a bullish reversal, while a move below $0.0541 would confirm further downside consistent with the prevailing weekly trend.
Previously it was reported that Kava faced lingering bearish pressure across multiple timeframes despite short-term momentum signals suggesting intermittent buyer interest. The latest data reinforce this negative outlook, with all key moving averages now overhead and risk concentrated around the $0.0541 support, making a potential breakdown below this level the critical event for traders to monitor.










-
 Afghanistan
-
 Albania
-
 Algeria
-
 Angola
-
 Argentina
-
 Armenia
-
 Australia
-
 Austria
-
 Azerbaijan
-
 Bahamas
-
 Bahrain
-
 Bangladesh
-
 Belarus
-
 Belgium
-
 Bolivia
-
 Botswana
-
 Brazil
-
 Brunei
-
 Bulgaria
-
 Cambodia
-
 Cameroon
-
 Canada
-
 Chile
Chile
-
 China
China
-
 Colombia
-
 Congo
Congo
-
 Costa Rica
-
 Cote d'Ivoire
-
 Croatia
-
 Cuba
Cuba
-
 Cyprus
-
 Czechia
-
 DR Congo
-
 Denmark
-
 Dominican Republic
-
 Ecuador
-
 Egypt
Egypt
-
 El Salvador
-
 Estonia
-
 Eswatini
-
 Ethiopia
-
 Finland
-
 France
-
 Georgia
-
 Germany
-
 Ghana
Ghana
-
 Greece
-
 Haiti
Haiti
-
 Hong Kong
-
 Hungary
-
 India
India
-
 Indonesia
-
 Iran, Islamic republic
-
 Iraq
Iraq
-
 Ireland
-
 Israel
-
 Italy
Italy
-
 Jamaica
-
 Japan
Japan
-
 Jordan
-
 Kazakhstan
-
 Kenya
Kenya
-
 Korea
Korea
-
 Kuwait
-
 Kyrgyzstan
-
 Laos
Laos
-
 Latvia
-
 Lebanon
-
 Lesotho
-
 Libya
Libya
-
 Lithuania
-
 Luxembourg
-
 Madagascar
-
 Malaysia
-
 Malta
Malta
-
 Mauritius
-
 Mexico
-
 Moldova
-
 Mongolia
-
 Montenegro
-
 Morocco
-
 Mozambique
-
 Myanmar
-
 Namibia
-
 Nepal
Nepal
-
 Netherlands
-
 New Zealand
-
 Nigeria
-
 North Macedonia
-
 Norway
-
 Oman
Oman
-
 Pakistan
-
 Palestine
-
 Panama
-
 Papua New Guinea
-
 Paraguay
-
 Peru
Peru
-
 Philippines
-
 Poland
-
 Portugal
-
 Puerto Rico
-
 Qatar
Qatar
-
 Reunion
-
 Romania
-
 Rwanda
-
 Saudi Arabia
-
 Serbia
-
 Singapore
-
 Slovakia
-
 Slovenia
-
 Somalia
-
 South Africa
-
 Spain
Spain
-
 Sri Lanka
-
 Sweden
-
 Switzerland
-
 Syria
Syria
-
 Taiwan
-
 Tajikistan
-
 Tanzania
-
 Thailand
-
 Trinidad and Tobago
-
 Tunisia
-
 Turkey
-
 UAE
UAE
-
 Uganda
-
 Ukraine
-
 United Kingdom
-
United States
-
 Uruguay
-
 Uzbekistan
-
 Venezuela
-
 Vietnam
-
 Yemen
Yemen
-
 Zambia
-
 Zimbabwe
- Forex
- Crypto












