
Ethereum: US Senate Clarity Act progress supports slight price gain

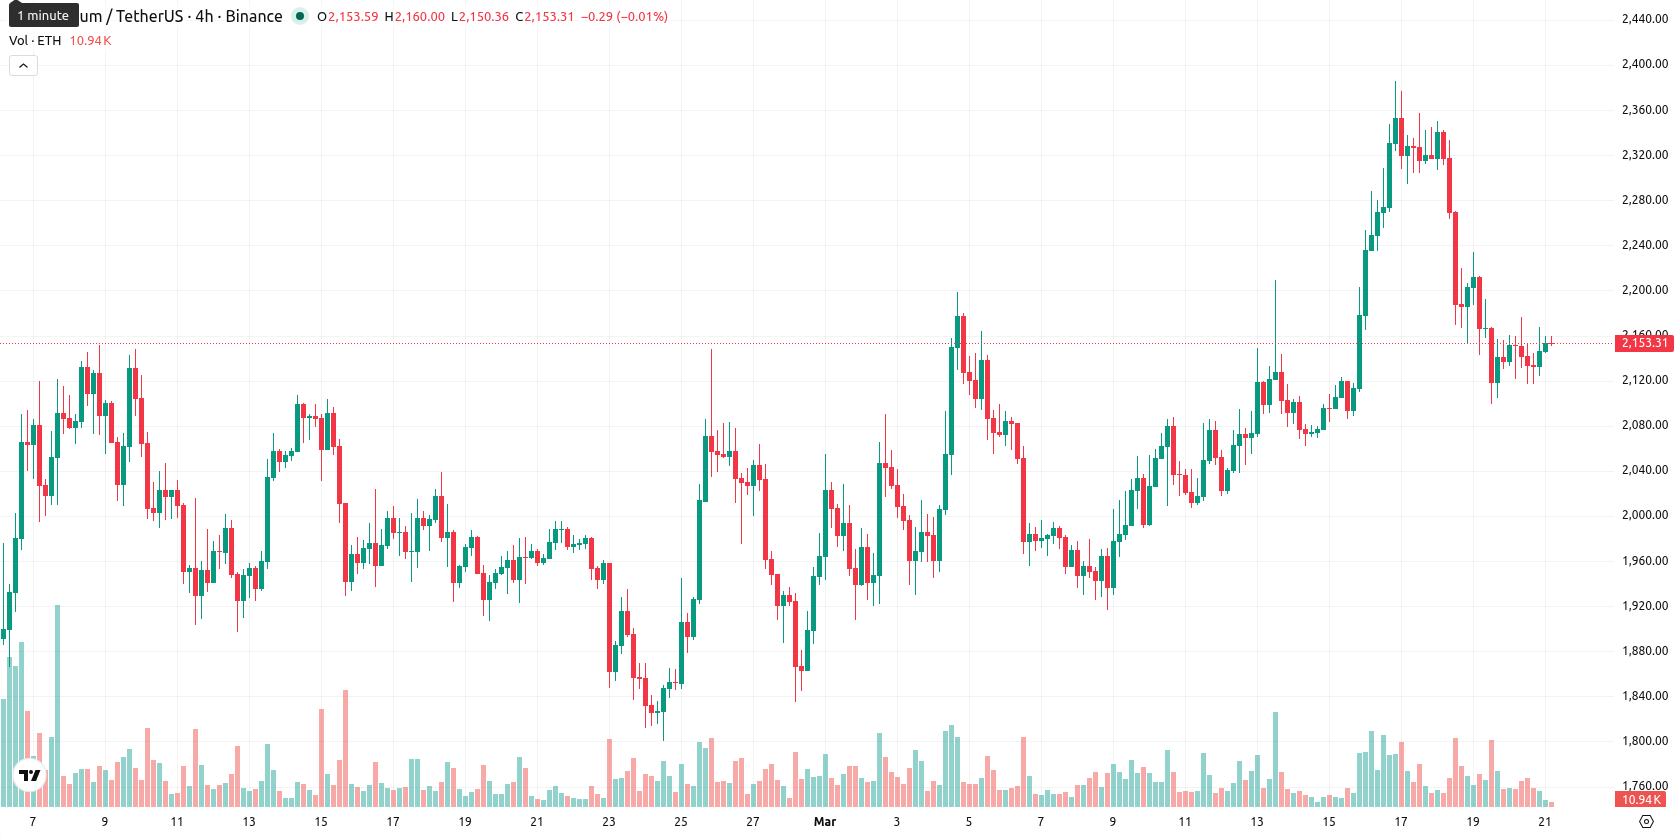
Ethereum (ETH) is trading at $2,152.59, recording a daily gain of 0.64%. The asset is positioned above the SMA-20 ($2,085.80) and SMA-50 ($2,070.86), indicating support in the short and medium term, but it remains well below the long-term SMA-200 at $3,182.66.
Highlights
- Escalating US-Israel-Iran tensions are increasing safe-haven demand, triggering capital rotation and heightened volatility in Ethereum markets.
- Ongoing spot ETF inflows and a rising validator queue signal institutional engagement, yet regulatory uncertainty from the US Senate clouds the medium-term outlook.
- Ethereum trades above short-term support with neutral-to-moderate bullish momentum, but a $2,100–$2,170 range and higher timeframe bearish signals indicate likely consolidation or decline.
Safe-haven flows and regulatory shifts drive Ethereum volatility
Escalating conflict between the US, Israel, and Iran has bolstered global safe-haven demand, triggering significant capital rotation and heightened volatility across digital assets including Ethereum. Sustained Middle East war has weighed on ETH, resulting in price rejections near key support levels and shifts in institutional positioning. The growing validator queue and heavy inflows into spot Ethereum ETFs since March 13 reflect ongoing regulatory clarity and increased institutional exposure, while the US Senate’s progress on the Clarity Act continues to introduce regulatory uncertainty into the medium-term outlook.
Mixed momentum and neutral RSI as key technical supports hold
Momentum signals are moderately bullish for ETH, with daily MACD and ADX pointing to upward potential, though the weekly MACD remains bearish. RSI is neutral and just above midpoint at 51.92, while Stoch RSI and CCI display mixed readings, indicating a lack of clear overbought or oversold conditions. Immediate support is found at the Ichimoku Kijun level on D1 ($2,093.01), which sits below the current price and is reinforced by the SMA-20 and SMA-50. ETH is trading near the upper end of today's range ($2,144.24 – $2,159.45), with BBP signaling overbought intraday conditions and the Awesome Oscillator remaining neutral.
Sideways consolidation likely as momentum fails to sustain breakout
For the coming week, ETH is expected to trade within a typical volatility band relative to current levels, between $2,100 and $2,170. The probability of a price increase is low (less than 20%), making a sideways consolidation or further decline more likely unless buying pressure sustains a breakout above $2,170. Should support at the Kijun ($2,093) break, downside risk could accelerate toward the $2,100 area or lower. Overall, the asset looks set to consolidate recent gains with continued downward risk unless a significant momentum shift emerges.
Earlier, analysts noted that Ethereum’s price action was characterized by cautious consolidation amid lingering macroeconomic pressures and hesitant market conviction. The latest developments reinforce this defensive tone, with geopolitical uncertainty and evolving institutional flows suggesting traders should closely monitor the $2,170 area for any signs of a sustained breakout or renewed downward momentum.


Latest Ethereum News


-
 Afghanistan
-
 Albania
-
 Algeria
-
 Angola
-
 Argentina
-
 Armenia
-
 Australia
-
 Austria
-
 Azerbaijan
-
 Bahamas
-
 Bahrain
-
 Bangladesh
-
 Belarus
-
 Belgium
-
 Bolivia
-
 Botswana
-
 Brazil
-
 Brunei
-
 Bulgaria
-
 Cambodia
-
 Cameroon
-
 Canada
-
 Chile
Chile
-
 China
China
-
 Colombia
-
 Congo
Congo
-
 Costa Rica
-
 Cote d'Ivoire
-
 Croatia
-
 Cuba
Cuba
-
 Cyprus
-
 Czechia
-
 DR Congo
-
 Denmark
-
 Dominican Republic
-
 Ecuador
-
 Egypt
Egypt
-
 El Salvador
-
 Estonia
-
 Eswatini
-
 Ethiopia
-
 Finland
-
 France
-
 Georgia
-
 Germany
-
 Ghana
Ghana
-
 Greece
-
 Haiti
Haiti
-
 Hong Kong
-
 Hungary
-
 India
India
-
 Indonesia
-
 Iran, Islamic republic
-
 Iraq
Iraq
-
 Ireland
-
 Israel
-
 Italy
Italy
-
 Jamaica
-
 Japan
Japan
-
 Jordan
-
 Kazakhstan
-
 Kenya
Kenya
-
 Korea
Korea
-
 Kuwait
-
 Kyrgyzstan
-
 Laos
Laos
-
 Latvia
-
 Lebanon
-
 Lesotho
-
 Libya
Libya
-
 Lithuania
-
 Luxembourg
-
 Madagascar
-
 Malaysia
-
 Malta
Malta
-
 Mauritius
-
 Mexico
-
 Moldova
-
 Mongolia
-
 Montenegro
-
 Morocco
-
 Mozambique
-
 Myanmar
-
 Namibia
-
 Nepal
Nepal
-
 Netherlands
-
 New Zealand
-
 Nigeria
-
 North Macedonia
-
 Norway
-
 Oman
Oman
-
 Pakistan
-
 Palestine
-
 Panama
-
 Papua New Guinea
-
 Paraguay
-
 Peru
Peru
-
 Philippines
-
 Poland
-
 Portugal
-
 Puerto Rico
-
 Qatar
Qatar
-
 Reunion
-
 Romania
-
 Rwanda
-
 Saudi Arabia
-
 Serbia
-
 Singapore
-
 Slovakia
-
 Slovenia
-
 Somalia
-
 South Africa
-
 Spain
Spain
-
 Sri Lanka
-
 Sweden
-
 Switzerland
-
 Syria
Syria
-
 Taiwan
-
 Tajikistan
-
 Tanzania
-
 Thailand
-
 Trinidad and Tobago
-
 Tunisia
-
 Turkey
-
 UAE
UAE
-
 Uganda
-
 Ukraine
-
 United Kingdom
-
United States
-
 Uruguay
-
 Uzbekistan
-
 Venezuela
-
 Vietnam
-
 Yemen
Yemen
-
 Zambia
-
 Zimbabwe
- Forex
- Crypto
