
Solana price prediction: Bearish bias as SOL struggles with institutional outflows and resistance

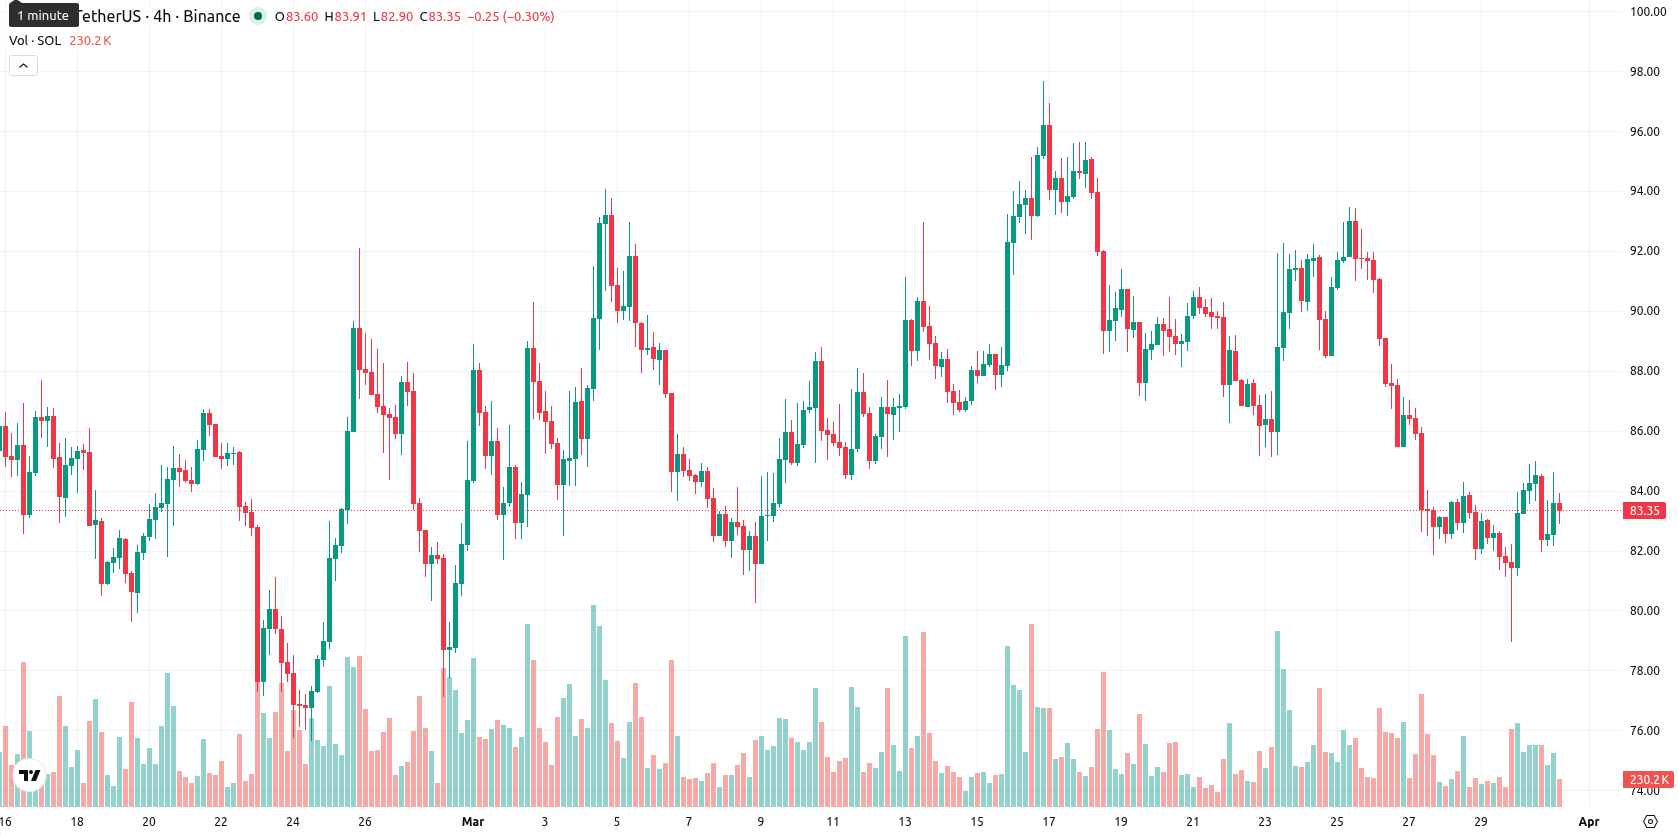
Solana (SOL) is trading at $83.77, below the SMA-20 ($88.25), SMA-50 ($85.87), and well below the SMA-200 ($140.47), reflecting persistent pressure from sellers across all key timeframes. The D1 Ichimoku Kijun is at $88.32, which sits above the current price and acts as immediate resistance.
Highlights
- Solana ETFs saw $7.84 million in outflows over three consecutive weeks, signaling sustained institutional capital withdrawal from SOL.
- Derivatives market activity revealed $22.98 million in long position liquidations and a negative funding rate, reflecting entrenched bearish sentiment.
- SOL trades below key moving averages with weak momentum indicators, and is expected to range between $80.00 and $88.50 amid prevailing downside bias.
Capitulation signals as institutional outflows and long liquidations accelerate
Solana experienced institutional outflows on March 30, 2026, as US spot Solana exchange-traded funds recorded $7.84 million in redemptions, marking the third consecutive week of net negative flows and indicating a shift in capital away from SOL. During the same period, the derivatives market saw liquidations totaling $22.98 million, primarily from long positions, alongside a negative funding rate of -0.0141%, underscoring a bearish trader outlook. Network fundamentals remained stable despite these developments.
Oversold signals clash with weak momentum as sellers maintain control
Daily momentum is weak, with the D1 MACD and ADX signaling a lack of bullish drive. Oversold readings from Stoch RSI and CCI, along with a low RSI (41.58), suggest the market is stretched to the downside but not yet reversing. BBP is negative and flagged as oversold, confirming sellers continue to dominate intraday momentum. No meaningful gap was observed at the open, as today’s session began near the previous close. The current price is near the middle of today’s range ($82.32 — $84.31). Volatility is moderate with an overall tone of sideways consolidation after an initial dip, as oscillators and momentum provide conflicting signals between oversold conditions and ongoing bearish pressure.
Downside favored as volatility bands constrain bullish reversal odds
For the coming week, the expected range is $80.00 — $88.50, keeping movements within a typical volatility band relative to current levels. The probability of an advance is very low (less than 20%), making further downside more likely. The baseline scenario is for SOL to remain in a sideways corridor between $80.00 and $88.50. A bullish scenario would require a breakout above the immediate resistance at $88.32, while a bearish scenario would see a sustained drop below $80.00, leading to additional losses. With weekly MA, RSI, ADX, and MACD all negative, sellers continue to dictate the market’s direction.
Earlier, analysts noted that persistent selling pressure and institutional outflows had established a broadly bearish outlook for Solana. The current analysis confirms this negative bias, as continued ETF redemptions and weak momentum indicators suggest traders should closely monitor the $80.00 level for potential downside acceleration in the near term.


-
 Afghanistan
-
 Albania
-
 Algeria
-
 Angola
-
 Argentina
-
 Armenia
-
 Australia
-
 Austria
-
 Azerbaijan
-
 Bahamas
-
 Bahrain
-
 Bangladesh
-
 Belarus
-
 Belgium
-
 Bolivia
-
 Botswana
-
 Brazil
-
 Brunei
-
 Bulgaria
-
 Cambodia
-
 Cameroon
-
 Canada
-
 Chile
Chile
-
 China
China
-
 Colombia
-
 Congo
Congo
-
 Costa Rica
-
 Cote d'Ivoire
-
 Croatia
-
 Cuba
Cuba
-
 Cyprus
-
 Czechia
-
 DR Congo
-
 Denmark
-
 Dominican Republic
-
 Ecuador
-
 Egypt
Egypt
-
 El Salvador
-
 Estonia
-
 Eswatini
-
 Ethiopia
-
 Finland
-
 France
-
 Georgia
-
 Germany
-
 Ghana
Ghana
-
 Greece
-
 Haiti
Haiti
-
 Hong Kong
-
 Hungary
-
 India
India
-
 Indonesia
-
 Iran, Islamic republic
-
 Iraq
Iraq
-
 Ireland
-
 Israel
-
 Italy
Italy
-
 Jamaica
-
 Japan
Japan
-
 Jordan
-
 Kazakhstan
-
 Kenya
Kenya
-
 Korea
Korea
-
 Kuwait
-
 Kyrgyzstan
-
 Laos
Laos
-
 Latvia
-
 Lebanon
-
 Lesotho
-
 Libya
Libya
-
 Lithuania
-
 Luxembourg
-
 Madagascar
-
 Malaysia
-
 Malta
Malta
-
 Mauritius
-
 Mexico
-
 Moldova
-
 Mongolia
-
 Montenegro
-
 Morocco
-
 Mozambique
-
 Myanmar
-
 Namibia
-
 Nepal
Nepal
-
 Netherlands
-
 New Zealand
-
 Nigeria
-
 North Macedonia
-
 Norway
-
 Oman
Oman
-
 Pakistan
-
 Palestine
-
 Panama
-
 Papua New Guinea
-
 Paraguay
-
 Peru
Peru
-
 Philippines
-
 Poland
-
 Portugal
-
 Puerto Rico
-
 Qatar
Qatar
-
 Reunion
-
 Romania
-
 Rwanda
-
 Saudi Arabia
-
 Serbia
-
 Singapore
-
 Slovakia
-
 Slovenia
-
 Somalia
-
 South Africa
-
 Spain
Spain
-
 Sri Lanka
-
 Sweden
-
 Switzerland
-
 Syria
Syria
-
 Taiwan
-
 Tajikistan
-
 Tanzania
-
 Thailand
-
 Trinidad and Tobago
-
 Tunisia
-
 Turkey
-
 UAE
UAE
-
 Uganda
-
 Ukraine
-
 United Kingdom
-
United States
-
 Uruguay
-
 Uzbekistan
-
 Venezuela
-
 Vietnam
-
 Yemen
Yemen
-
 Zambia
-
 Zimbabwe
- Forex
- Crypto
