
LINK edges higher as technical indicators highlight persistent selling momentum: weekly outlook

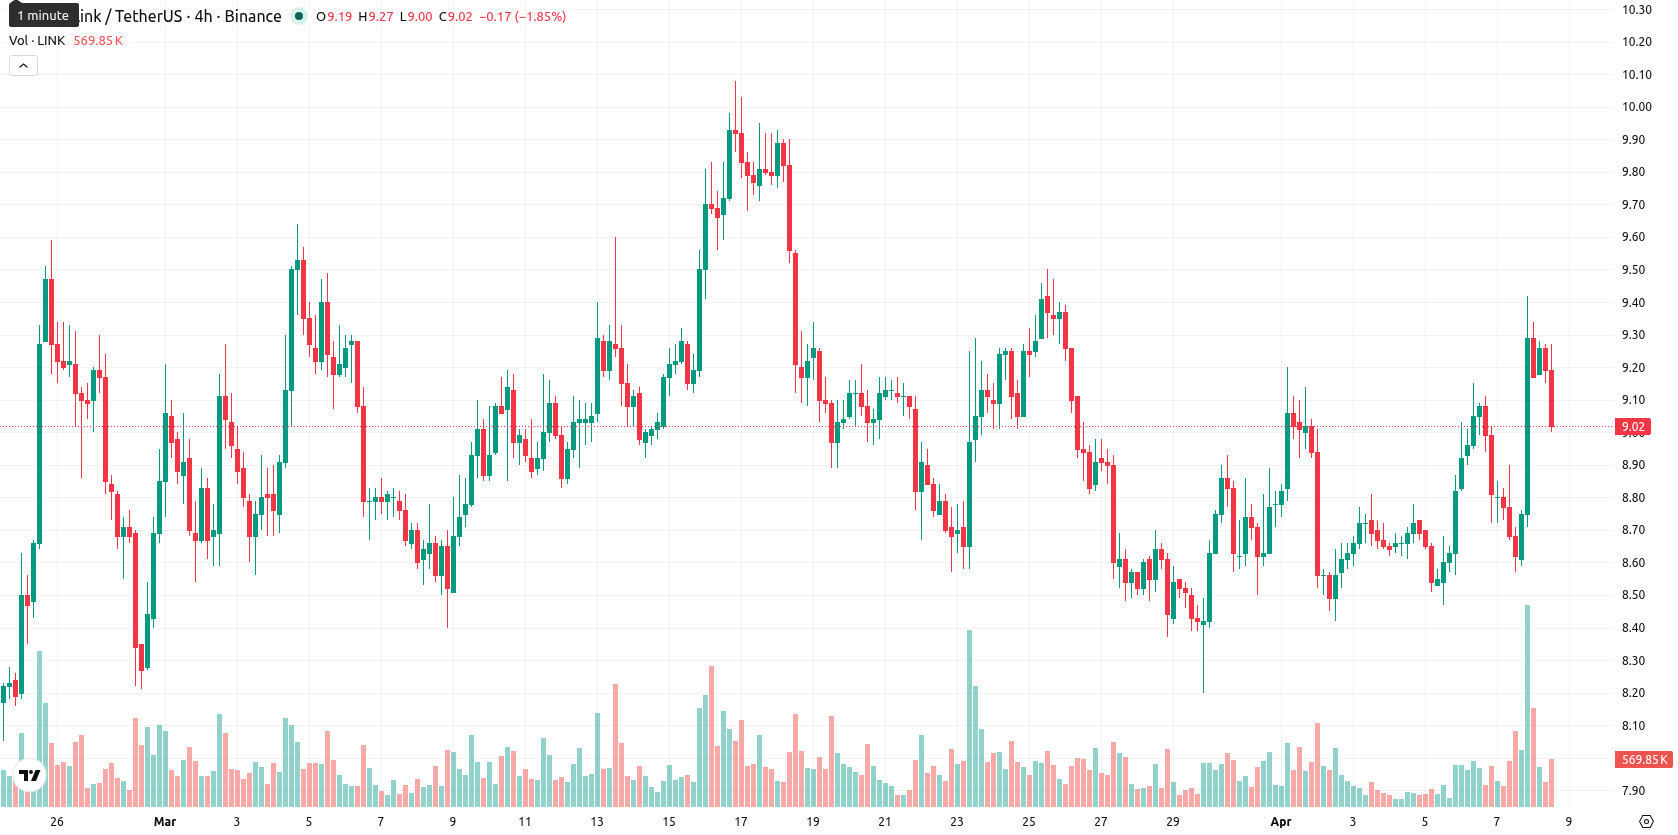
Chainlink (LINK) is currently trading at $9.11, ending the week up $0.14 (1.56%) from last week’s close of $8.97. The price remains below its key weekly moving averages — MA-20 at $10.69, MA-50 at $15.02, and MA-200 at $12.43 — putting LINK in a recovery posture but still under broader downside technical pressure.
Highlights
- Chainlink trades below major moving averages, signaling ongoing downside pressure in both medium- and long-term trends.
- Momentum indicators confirm pronounced seller dominance and suggest little probability of a sustainable upward move in the near term.
- Expected price range for the next week is $9.02 to $9.45, with sideways movement likely unless support at $9.02 fails.
Institutional inflows and corporate adoption drive bullish sentiment this week
Chainlink saw significant institutional adoption as Grayscale's GLNK trust and Bitwise's CLNK fund attracted a combined $88 million in investments, with the Hashdex Nasdaq Crypto Index ETF adding LINK to its holdings. The network achieved over 2,000 integrations across DeFi, insurance, and enterprise settlement sectors, powering $27 trillion in on-chain data value. Major firms such as JPMorgan and UBS initiated live settlement trials using Chainlink's Cross-Chain Interoperability Protocol, while Coinbase deployed Chainlink DataLink across more than 50 blockchains. On-chain trends also pointed to a yearly high in wallet accumulation and $18 billion in monthly protocol volume, with the ADI Foundation selecting Chainlink for a $240 billion institutional asset bridge.
Persistent selling momentum dominates weekly technicals despite partial recovery
Technical indicators on the weekly timeframe highlight persistent selling momentum for LINK, as it trades below the MA-20, MA-50, and MA-200. Support is seen near $9.02 with resistance at $9.45, while weekly volatility measures 11.88%. The MACD is a strong sell, ADX signals bearish momentum, and both RSI and CCI indicate sellers dominate, with Stochastic RSI showing a neutral stance and Bull/Bear Power reflecting oversold conditions. Oscillators are mixed as price recovers slightly, but overall, momentum remains negative.
Neutral to bearish outlook as sideways action expected in coming week
Over the next 7 days, LINK is forecast to range between $9.02 and $9.45, reflecting ongoing weak momentum on weekly technicals. There is a much higher probability of sideways or lower movement, as none of the four key indicators (RSI, ADX, MACD, CCI) support a bullish reversal. Baseline expectations suggest continued consolidation within this channel. An upside break above $9.45 could trigger more buying, while a fall below $9.02 may lead to further losses.
Earlier, analysts noted that Chainlink was experiencing short-term stabilization amid long-term bearish technical pressure and heightened volatility. The current setup reinforces this cautious view, as persistent bearish momentum and a lack of convincing bullish signals suggest traders should closely monitor the $9.02 support for potential breakdown risks in the week ahead.


-
 Afghanistan
-
 Albania
-
 Algeria
-
 Angola
-
 Argentina
-
 Armenia
-
 Australia
-
 Austria
-
 Azerbaijan
-
 Bahamas
-
 Bahrain
-
 Bangladesh
-
 Belarus
-
 Belgium
-
 Bolivia
-
 Botswana
-
 Brazil
-
 Brunei
-
 Bulgaria
-
 Cambodia
-
 Cameroon
-
 Canada
-
 Chile
Chile
-
 China
China
-
 Colombia
-
 Congo
Congo
-
 Costa Rica
-
 Cote d'Ivoire
-
 Croatia
-
 Cuba
Cuba
-
 Cyprus
-
 Czechia
-
 DR Congo
-
 Denmark
-
 Dominican Republic
-
 Ecuador
-
 Egypt
Egypt
-
 El Salvador
-
 Estonia
-
 Eswatini
-
 Ethiopia
-
 Finland
-
 France
-
 Georgia
-
 Germany
-
 Ghana
Ghana
-
 Greece
-
 Haiti
Haiti
-
 Hong Kong
-
 Hungary
-
 India
India
-
 Indonesia
-
 Iran, Islamic republic
-
 Iraq
Iraq
-
 Ireland
-
 Israel
-
 Italy
Italy
-
 Jamaica
-
 Japan
Japan
-
 Jordan
-
 Kazakhstan
-
 Kenya
Kenya
-
 Korea
Korea
-
 Kuwait
-
 Kyrgyzstan
-
 Laos
Laos
-
 Latvia
-
 Lebanon
-
 Lesotho
-
 Libya
Libya
-
 Lithuania
-
 Luxembourg
-
 Madagascar
-
 Malaysia
-
 Malta
Malta
-
 Mauritius
-
 Mexico
-
 Moldova
-
 Mongolia
-
 Montenegro
-
 Morocco
-
 Mozambique
-
 Myanmar
-
 Namibia
-
 Nepal
Nepal
-
 Netherlands
-
 New Zealand
-
 Nigeria
-
 North Macedonia
-
 Norway
-
 Oman
Oman
-
 Pakistan
-
 Palestine
-
 Panama
-
 Papua New Guinea
-
 Paraguay
-
 Peru
Peru
-
 Philippines
-
 Poland
-
 Portugal
-
 Puerto Rico
-
 Qatar
Qatar
-
 Reunion
-
 Romania
-
 Rwanda
-
 Saudi Arabia
-
 Serbia
-
 Singapore
-
 Slovakia
-
 Slovenia
-
 Somalia
-
 South Africa
-
 Spain
Spain
-
 Sri Lanka
-
 Sweden
-
 Switzerland
-
 Syria
Syria
-
 Taiwan
-
 Tajikistan
-
 Tanzania
-
 Thailand
-
 Trinidad and Tobago
-
 Tunisia
-
 Turkey
-
 UAE
UAE
-
 Uganda
-
 Ukraine
-
 United Kingdom
-
United States
-
 Uruguay
-
 Uzbekistan
-
 Venezuela
-
 Vietnam
-
 Yemen
Yemen
-
 Zambia
-
 Zimbabwe
- Forex
- Crypto
