
Stellar falls 4.74% with bearish momentum dominating below $0.1902 resistance: weekly forecast

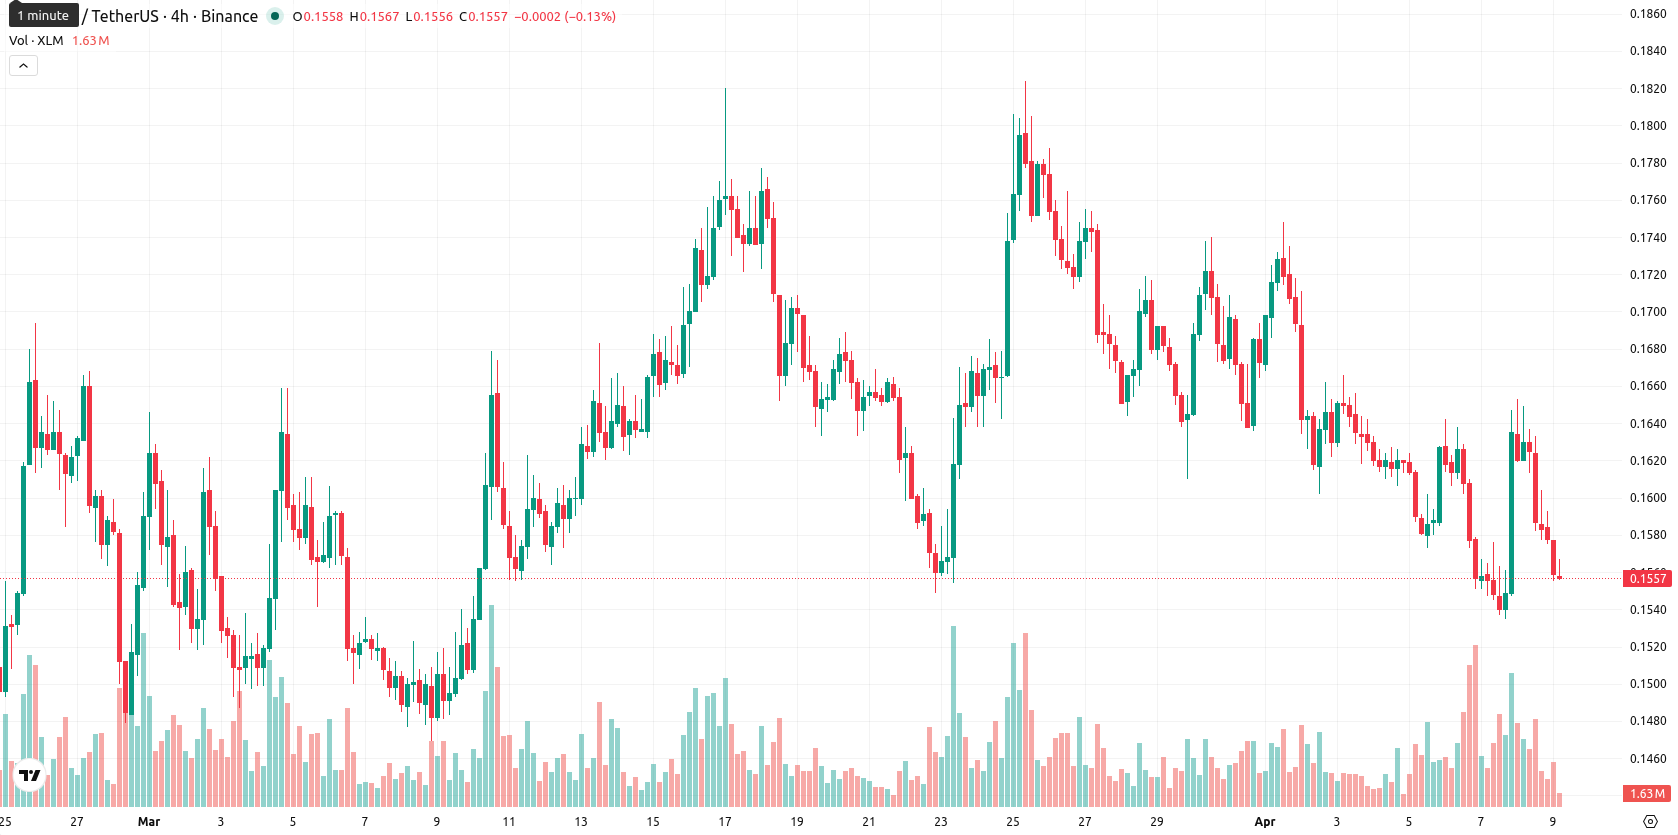
Stellar (XLM) is currently trading at $0.1559, having declined $0.0079 (4.74%) over the past week. XLM remains well below its weekly MA-20 ($0.1902), MA-50 ($0.2771), and MA-200 ($0.1784), signaling strong ongoing selling pressure and a clear bearish bias on the weekly timeframe.
Highlights
- XLM remains under strong selling pressure, trading decisively below medium- and long-term moving average resistance levels.
- Momentum and trend signals are bearish across all major indicators, with no evidence of an imminent reversal or oversold conditions.
- Price is likely to drift sideways or decline further within a $0.1535–$0.1662 range over the next 7 days, with rebound probability below 20%.
Consolidation phase extends as low volatility and lack of news shape trade
Stellar has entered a consolidation phase, with trading activity and volumes remaining steady on major platforms such as Binance. There have been no significant catalyst events, institutional commentary, or major updates regarding the ecosystem, regulations, or products announced this week. Market participants continue to focus on technical support and resistance levels, with the asset's long-term trend lines drawing particular scrutiny.
Bearish momentum entrenched as technical indicators weaken over the week
On the weekly chart, bearish momentum dominates, as XLM closes the week at the lowest point of its range. The price remains decisively under the MA-20, MA-50, and MA-200, with the Ichimoku Kijun line acting as distant resistance at $0.2454. Weekly indicators are deeply negative: the MACD signals strong selling, the ADX measures a weak 22.8, and both RSI (34.8) and CCI (–70.9) point to persistent downside but not yet to oversold territory. Stochastic RSI is neutral, while Bull/Bear Power remains negative. Strong resistance is now found at the MA-20, while nearby support is seen at $0.1535, followed by resistance at $0.1662.
Sideways bias expected as negative signals and volatility cap upside
For the next 7 days, XLM is expected to trade in a range of $0.1535 — $0.1662, mirroring recent volatility and continued negative momentum from all key weekly indicators. The base scenario calls for continued sideways movement within this corridor, while a bullish breakout above $0.1662 could signal a test of the MA-20 resistance. Conversely, a drop below $0.1535 would likely lead to retests of 2024 lows. Given that none of the top four weekly indicators show buy signals and selling pressure persists, the probability of a bullish reversal is less than 20%.
Earlier, analysts noted that Stellar was demonstrating short- and medium-term bullish momentum, though it remained constrained by longer-term resistance. The current market environment marks a significant shift to a bearish bias, with traders advised to monitor for a decisive move below $0.1535 as it could open the door to retests of 2024 lows.


-
 Afghanistan
-
 Albania
-
 Algeria
-
 Angola
-
 Argentina
-
 Armenia
-
 Australia
-
 Austria
-
 Azerbaijan
-
 Bahamas
-
 Bahrain
-
 Bangladesh
-
 Belarus
-
 Belgium
-
 Bolivia
-
 Botswana
-
 Brazil
-
 Brunei
-
 Bulgaria
-
 Cambodia
-
 Cameroon
-
 Canada
-
 Chile
Chile
-
 China
China
-
 Colombia
-
 Congo
Congo
-
 Costa Rica
-
 Cote d'Ivoire
-
 Croatia
-
 Cuba
Cuba
-
 Cyprus
-
 Czechia
-
 DR Congo
-
 Denmark
-
 Dominican Republic
-
 Ecuador
-
 Egypt
Egypt
-
 El Salvador
-
 Estonia
-
 Eswatini
-
 Ethiopia
-
 Finland
-
 France
-
 Georgia
-
 Germany
-
 Ghana
Ghana
-
 Greece
-
 Haiti
Haiti
-
 Hong Kong
-
 Hungary
-
 India
India
-
 Indonesia
-
 Iran, Islamic republic
-
 Iraq
Iraq
-
 Ireland
-
 Israel
-
 Italy
Italy
-
 Jamaica
-
 Japan
Japan
-
 Jordan
-
 Kazakhstan
-
 Kenya
Kenya
-
 Korea
Korea
-
 Kuwait
-
 Kyrgyzstan
-
 Laos
Laos
-
 Latvia
-
 Lebanon
-
 Lesotho
-
 Libya
Libya
-
 Lithuania
-
 Luxembourg
-
 Madagascar
-
 Malaysia
-
 Malta
Malta
-
 Mauritius
-
 Mexico
-
 Moldova
-
 Mongolia
-
 Montenegro
-
 Morocco
-
 Mozambique
-
 Myanmar
-
 Namibia
-
 Nepal
Nepal
-
 Netherlands
-
 New Zealand
-
 Nigeria
-
 North Macedonia
-
 Norway
-
 Oman
Oman
-
 Pakistan
-
 Palestine
-
 Panama
-
 Papua New Guinea
-
 Paraguay
-
 Peru
Peru
-
 Philippines
-
 Poland
-
 Portugal
-
 Puerto Rico
-
 Qatar
Qatar
-
 Reunion
-
 Romania
-
 Rwanda
-
 Saudi Arabia
-
 Serbia
-
 Singapore
-
 Slovakia
-
 Slovenia
-
 Somalia
-
 South Africa
-
 Spain
Spain
-
 Sri Lanka
-
 Sweden
-
 Switzerland
-
 Syria
Syria
-
 Taiwan
-
 Tajikistan
-
 Tanzania
-
 Thailand
-
 Trinidad and Tobago
-
 Tunisia
-
 Turkey
-
 UAE
UAE
-
 Uganda
-
 Ukraine
-
 United Kingdom
-
United States
-
 Uruguay
-
 Uzbekistan
-
 Venezuela
-
 Vietnam
-
 Yemen
Yemen
-
 Zambia
-
 Zimbabwe
- Forex
- Crypto
