
+7.00% for Aptos as buyback program is under consideration

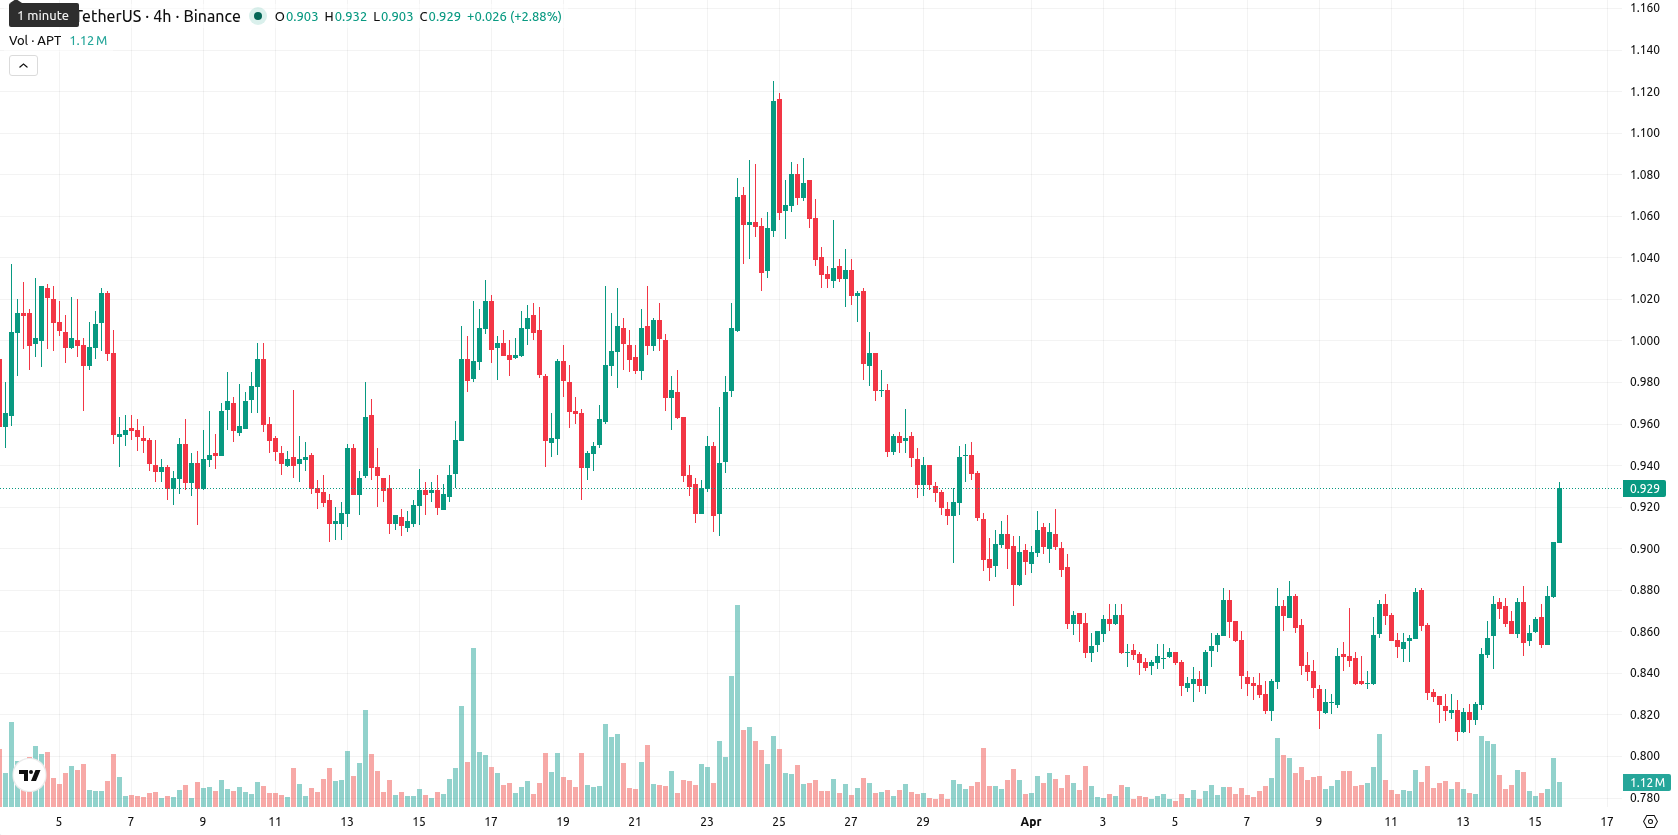
Aptos (APT) is trading at $0.932, which is above the MA-20 ($0.8807) but just below the MA-50 ($0.9342), reflecting short-term buyer momentum but medium-term residual selling pressure. The price remains well below the MA-200 ($1.9839), indicating persistent long-term bearish bias; the Ichimoku Kijun stands at $0.9660, acting as immediate resistance.
 0.608
0.6330
0.608
0.6330
Highlights
- Aptos imposed a 2.1 billion APT token hard cap and linked future emissions to milestone achievements, aiming to strengthen supply discipline.
- The Foundation permanently locked 210 million APT, cut staking rewards to 2.6%, hiked gas fees tenfold, and expects annual burns exceeding 32 million APT after DEX launch.
- APT trades in a volatile $0.923–$0.944 range with conflicted momentum and oscillators, signaling greater short-term downside probability despite recent intraday gains.
Token supply limits and reduced rewards as Aptos overhauls tokenomics
On April 14, 2026, Aptos announced new tokenomics for APT, instituting a hard cap of 2.1 billion tokens, with 210 million APT permanently locked by the Aptos Foundation, and reducing the annual staking reward rate to 2.6%. The protocol raised network gas fees tenfold and tied future token emissions and grants to milestone achievements. The Foundation is also considering a buyback program and expects over 32 million APT to be burned each year after the planned launch of a new DEX.
Upward price volatility as technical indicators signal mixed momentum
Momentum readings are conflicted: the D1 MACD signals strong sell pressure, while ADX is neutral, suggesting a weak trend. RSI at 44.94 and CCI near -33 point to non-overbought, non-oversold conditions, whereas Stoch RSI flags overbought risk; BBP indicates buyer dominance intraday. Despite these mixed signals, the AO is neutral, and today’s price has risen 7.00% from the previous session, with no meaningful gap between yesterday’s close ($0.871) and today’s open ($0.86). The price currently sits near the day’s high of $0.923 in a range of $0.853 – $0.923, indicating high volatility and strong upward tone through the session; nonetheless, momentum and oscillators show notable divergences, warranting caution.
Downside risk rises as sell signals dominate short-term outlook
For the next five trading days, the expected range is $0.923 to $0.944, fitting within a volatility band relative to current levels. The probability of a further price increase is very low (less than 20%), making a decrease the more likely short-term scenario given strong sell signals from weekly MA-50, RSI, ADX, and MACD. Baseline: price consolidates within $0.923 – $0.944. Bullish scenario: a break above $0.966 triggers further short-term recovery toward new resistance; bearish scenario: a drop below $0.923 brings renewed downside risk toward previous session lows.
Earlier, analysts noted that Aptos was entrenched in sustained bearish momentum, with technical factors favoring continued downside risk. The latest developments in tokenomics and mixed short-term technical signals introduce a potential inflection point, making the $0.9660 resistance level critical to watch for any shift in trend direction.







-
 Afghanistan
-
 Albania
-
 Algeria
-
 Angola
-
 Argentina
-
 Armenia
-
 Australia
-
 Austria
-
 Azerbaijan
-
 Bahamas
-
 Bahrain
-
 Bangladesh
-
 Belarus
-
 Belgium
-
 Bolivia
-
 Botswana
-
 Brazil
-
 Brunei
-
 Bulgaria
-
 Cambodia
-
 Cameroon
-
 Canada
-
 Chile
Chile
-
 China
China
-
 Colombia
-
 Congo
Congo
-
 Costa Rica
-
 Cote d'Ivoire
-
 Croatia
-
 Cuba
Cuba
-
 Cyprus
-
 Czechia
-
 DR Congo
-
 Denmark
-
 Dominican Republic
-
 Ecuador
-
 Egypt
Egypt
-
 El Salvador
-
 Estonia
-
 Eswatini
-
 Ethiopia
-
 Finland
-
 France
-
 Georgia
-
 Germany
-
 Ghana
Ghana
-
 Greece
-
 Haiti
Haiti
-
 Hong Kong
-
 Hungary
-
 India
India
-
 Indonesia
-
 Iran, Islamic republic
-
 Iraq
Iraq
-
 Ireland
-
 Israel
-
 Italy
Italy
-
 Jamaica
-
 Japan
Japan
-
 Jordan
-
 Kazakhstan
-
 Kenya
Kenya
-
 Korea
Korea
-
 Kuwait
-
 Kyrgyzstan
-
 Laos
Laos
-
 Latvia
-
 Lebanon
-
 Lesotho
-
 Libya
Libya
-
 Lithuania
-
 Luxembourg
-
 Madagascar
-
 Malaysia
-
 Malta
Malta
-
 Mauritius
-
 Mexico
-
 Moldova
-
 Mongolia
-
 Montenegro
-
 Morocco
-
 Mozambique
-
 Myanmar
-
 Namibia
-
 Nepal
Nepal
-
 Netherlands
-
 New Zealand
-
 Nigeria
-
 North Macedonia
-
 Norway
-
 Oman
Oman
-
 Pakistan
-
 Palestine
-
 Panama
-
 Papua New Guinea
-
 Paraguay
-
 Peru
Peru
-
 Philippines
-
 Poland
-
 Portugal
-
 Puerto Rico
-
 Qatar
Qatar
-
 Reunion
-
 Romania
-
 Rwanda
-
 Saudi Arabia
-
 Serbia
-
 Singapore
-
 Slovakia
-
 Slovenia
-
 Somalia
-
 South Africa
-
 Spain
Spain
-
 Sri Lanka
-
 Sweden
-
 Switzerland
-
 Syria
Syria
-
 Taiwan
-
 Tajikistan
-
 Tanzania
-
 Thailand
-
 Trinidad and Tobago
-
 Tunisia
-
 Turkey
-
 UAE
UAE
-
 Uganda
-
 Ukraine
-
 United Kingdom
-
United States
-
 Uruguay
-
 Uzbekistan
-
 Venezuela
-
 Vietnam
-
 Yemen
Yemen
-
 Zambia
-
 Zimbabwe
- Forex
- Crypto











