

Short-term overextension prompts Immutable X to extend gains above key levels

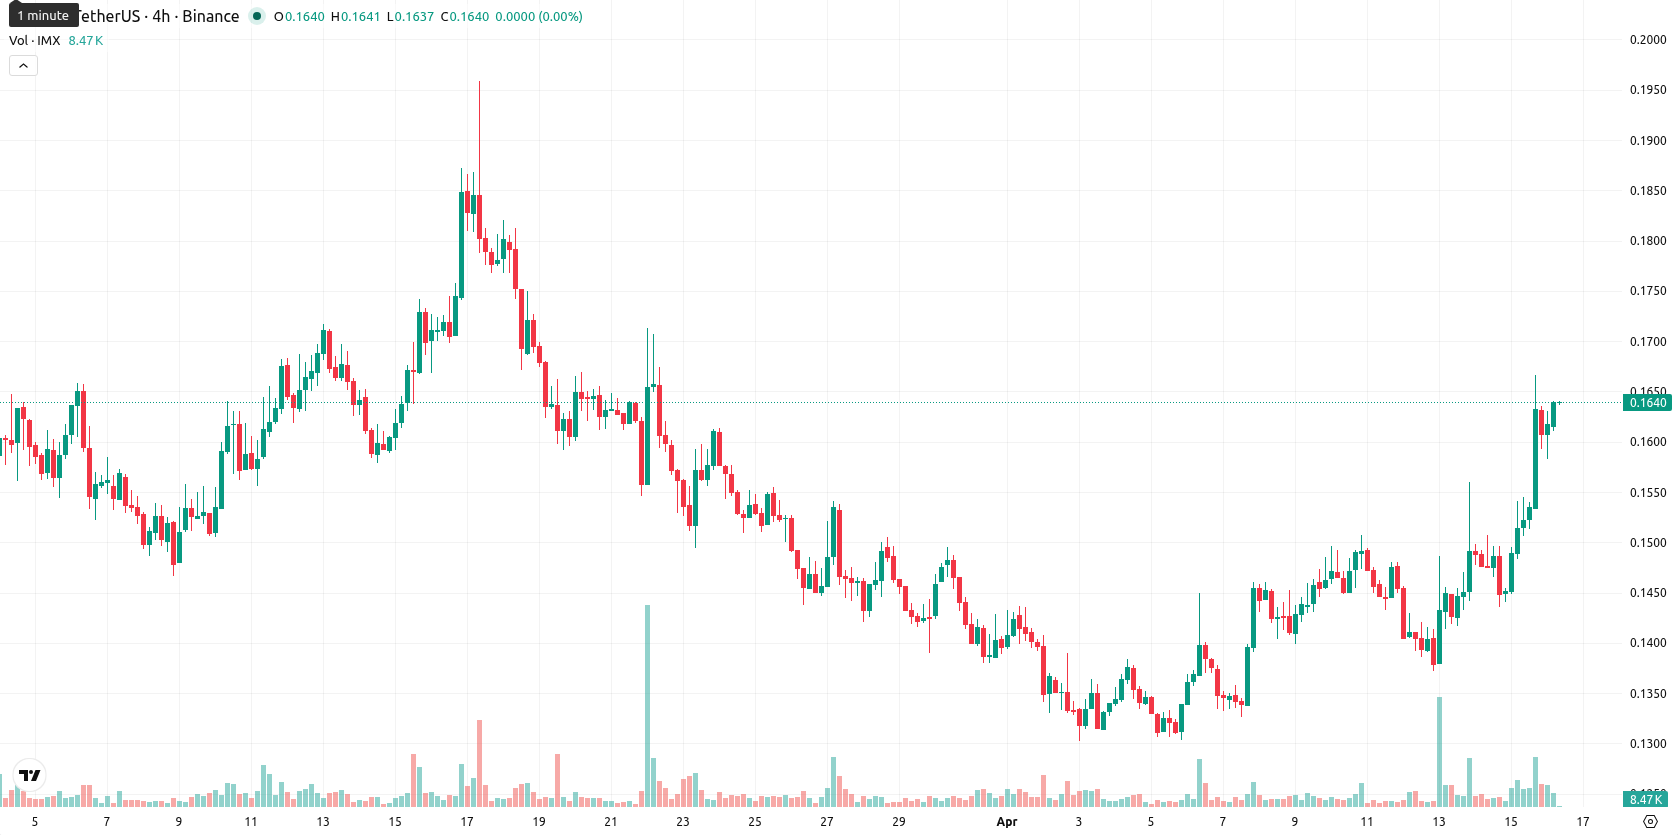
Immutable X (IMX) is trading at $0.1636, above both its MA-20 at $0.1423 and MA-50 at $0.1540, suggesting short- and medium-term bullish momentum. The current price remains far below the MA-200 ($0.2973), confirming longer-term downside pressure; the Ichimoku Kijun at $0.1508 sits below the current price and acts as immediate support.
 0.1223
0.1268
Highlights
- IMX trades with short-term bullish momentum above key short and medium moving averages, but faces persistent long-term downtrend pressure.
- Overbought technical signals and mixed momentum indicators point to heightened volatility and increased downside risk after recent intraday rally.
- Expected 5-day price range is $0.1550–$0.1750, with sideway movement favored and further upside probability below 20%.
Intraday gains diverge from weak momentum and overbought signals
Momentum readings are mixed: D1 MACD signals strong sell while ADX is neutral and weak. Overbought signals are evident from Stoch RSI (100) and CCI (212), yet D1 RSI at 59 is moderately bullish. BBP indicates strong buyer dominance intraday, aligning with today’s strong move up (daily change 8.2%). There was a mild gap up from the previous close ($0.1512) to today’s open ($0.1608). The current price is near the top end of today’s $0.1583 – $0.1638 range, reflecting high intraday volatility and persistent strength after the open. This intraday rally is somewhat at odds with weak MACD and overbought signals, highlighting a short-term divergence between momentum and price action.
Downside risk increases as technicals signal bearish lean
Looking ahead, the expected price range for the next 5 days is $0.1550 to $0.1750, forming a volatility band relative to current levels. The probability of further upside is very low (less than 20%), with a decline being more likely given all key weekly indicators (RSI, ADX, MACD, MA-50) showing sell signals. The baseline scenario is sideways movement near current levels. A bullish scenario would require a break above $0.1750 on renewed buyer momentum, while a bearish scenario would see a move below $0.1550 and loss of immediate support.
Earlier, analysts noted that Immutable X remained constrained by sustained selling pressure despite intermittent rebounds. The latest data adds a new dimension, as short-term bullish momentum contrasts with cautionary weekly signals, making heightened volatility and a potential shift in trend direction a key risk for traders to monitor in the near term.










-
 Afghanistan
-
 Albania
-
 Algeria
-
 Angola
-
 Argentina
-
 Armenia
-
 Australia
-
 Austria
-
 Azerbaijan
-
 Bahamas
-
 Bahrain
-
 Bangladesh
-
 Belarus
-
 Belgium
-
 Bolivia
-
 Botswana
-
 Brazil
-
 Brunei
-
 Bulgaria
-
 Cambodia
-
 Cameroon
-
 Canada
-
 Chile
-
 China
-
 Colombia
-
 Congo
-
 Costa Rica
-
 Cote d'Ivoire
-
 Croatia
-
 Cuba
-
 Cyprus
-
 Czechia
-
 DR Congo
-
 Denmark
-
 Dominican Republic
-
 Ecuador
-
 Egypt
-
 El Salvador
-
 Estonia
-
 Eswatini
-
 Ethiopia
-
 Finland
-
 France
-
 Georgia
-
 Germany
-
 Ghana
-
 Greece
-
 Haiti
-
 Hong Kong
-
 Hungary
-
 India
-
 Indonesia
-
 Iran, Islamic republic
-
 Iraq
-
 Ireland
-
 Israel
-
 Italy
-
 Jamaica
-
 Japan
-
 Jordan
-
 Kazakhstan
-
 Kenya
-
 Korea
-
 Kuwait
-
 Kyrgyzstan
-
 Laos
-
 Latvia
-
 Lebanon
-
 Lesotho
-
 Libya
-
 Lithuania
-
 Luxembourg
-
 Madagascar
-
 Malaysia
-
 Malta
-
 Mauritius
-
 Mexico
-
 Moldova
-
 Mongolia
-
 Montenegro
-
 Morocco
-
 Mozambique
-
 Myanmar
-
 Namibia
-
 Nepal
-
 Netherlands
-
 New Zealand
-
 Nigeria
-
 North Macedonia
-
 Norway
-
 Oman
-
 Pakistan
-
 Palestine
-
 Panama
-
 Papua New Guinea
-
 Paraguay
-
 Peru
-
 Philippines
-
 Poland
-
 Portugal
-
 Puerto Rico
-
 Qatar
-
 Reunion
-
 Romania
-
 Rwanda
-
 Saudi Arabia
-
 Serbia
-
 Singapore
-
 Slovakia
-
 Slovenia
-
 Somalia
-
 South Africa
-
 Spain
-
 Sri Lanka
-
 Sweden
-
 Switzerland
-
 Syria
-
 Taiwan
-
 Tajikistan
-
 Tanzania
-
 Thailand
-
 Trinidad and Tobago
-
 Tunisia
-
 Turkey
-
 UAE
-
 Uganda
-
 Ukraine
-
 United Kingdom
-
United States
-
 Uruguay
-
 Uzbekistan
-
 Venezuela
-
 Vietnam
-
 Yemen
-
 Zambia
-
 Zimbabwe
- Forex
- Crypto












