
Price rebound from below-average levels lifts Optimism over 7%

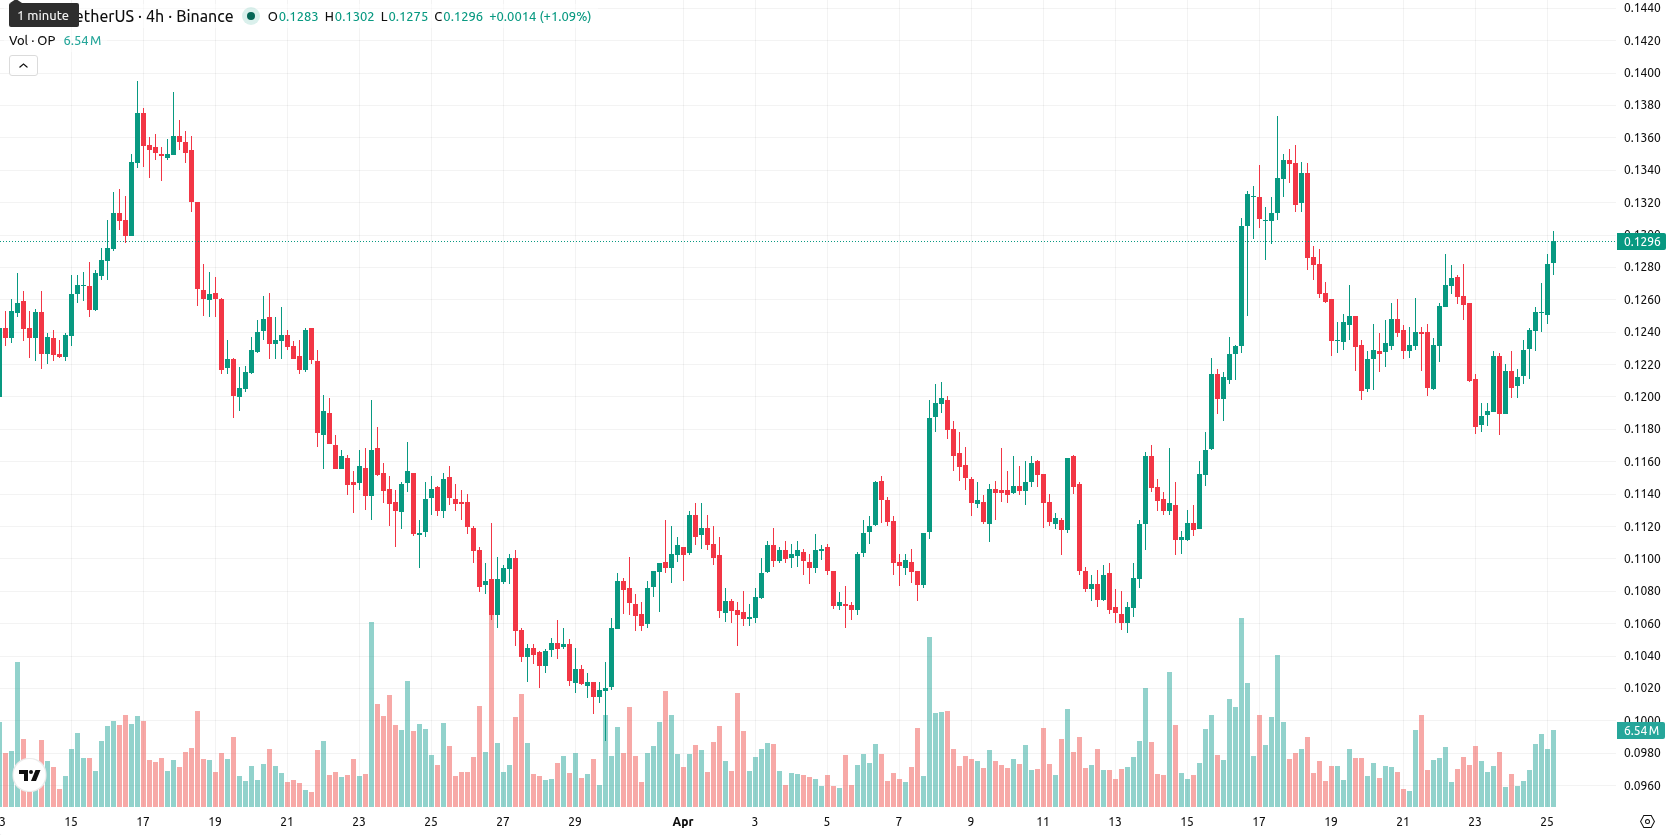
Optimism (OP) is trading at $0.1297 after rising 7.19% today, tracking firmly above its key moving averages. The asset remains positioned on the high side of its intraday range, reflecting sustained short-term strength versus recent averages.
 0.0882
0.0991
0.0882
0.0991
Highlights
- OP shows short-term bullish momentum, trading above key short-term averages but remains in a longer-term downtrend.
- Momentum indicators and oscillators signal modest bullishness, though some lower timeframes approach overbought territory.
- Five-day forecast expects OP to consolidate between $0.124 and $0.136, with increased risk of reversal or retracement.
Bullish momentum confirmed as technical support underpins trend
OP trades above the SMA-20 ($0.1190) and SMA-50 ($0.1175), while remaining significantly below the long-term SMA-200 ($0.2646). The Ichimoku Kijun level at $0.1196 sits beneath the current price, providing immediate technical support. On the momentum side, the D1 MACD issues a buy signal, while ADX at 22.15, Stoch RSI at 62.83 (Buy), and CCI at 59.86 (Buy) suggest bullish momentum, complemented by an RSI reading of 54.98 in neutral-bullish territory. Bull/Bear Power (BBP) confirms a buyers’ advantage intraday, and oscillators overall align with the strength of today’s move, with no major divergences apparent.
Reversal favored as breakout likelihood remains subdued
For the next five trading days, the typical volatility band is projected between $0.124 and $0.136. The probability of an extension beyond the $0.136 resistance is limited (less than 20%), so a reversal or pullback scenario is more likely. Baseline expectations call for OP to consolidate in this range, while a clear breakout above $0.136 would open room for further gains if momentum builds. Conversely, a decisive loss of the $0.124 support could trigger a deeper retracement.
Earlier, analysts noted that Optimism faced firm bearish momentum, with technical weakness dominating its price action. However, the current uptick in bullish indicators suggests a short-term shift in sentiment, making the $0.136 resistance a pivotal level to watch for signs of renewed upside or a potential reversal in the coming days.


Latest Optimism News






-
 Afghanistan
-
 Albania
-
 Algeria
-
 Angola
-
 Argentina
-
 Armenia
-
 Australia
-
 Austria
-
 Azerbaijan
-
 Bahamas
-
 Bahrain
-
 Bangladesh
-
 Belarus
-
 Belgium
-
 Bolivia
-
 Botswana
-
 Brazil
-
 Brunei
-
 Bulgaria
-
 Cambodia
-
 Cameroon
-
 Canada
-
 Chile
Chile
-
 China
China
-
 Colombia
-
 Congo
Congo
-
 Costa Rica
-
 Cote d'Ivoire
-
 Croatia
-
 Cuba
Cuba
-
 Cyprus
-
 Czechia
-
 DR Congo
-
 Denmark
-
 Dominican Republic
-
 Ecuador
-
 Egypt
Egypt
-
 El Salvador
-
 Estonia
-
 Eswatini
-
 Ethiopia
-
 Finland
-
 France
-
 Georgia
-
 Germany
-
 Ghana
Ghana
-
 Greece
-
 Haiti
Haiti
-
 Hong Kong
-
 Hungary
-
 India
India
-
 Indonesia
-
 Iran, Islamic republic
-
 Iraq
Iraq
-
 Ireland
-
 Israel
-
 Italy
Italy
-
 Jamaica
-
 Japan
Japan
-
 Jordan
-
 Kazakhstan
-
 Kenya
Kenya
-
 Korea
Korea
-
 Kuwait
-
 Kyrgyzstan
-
 Laos
Laos
-
 Latvia
-
 Lebanon
-
 Lesotho
-
 Libya
Libya
-
 Lithuania
-
 Luxembourg
-
 Madagascar
-
 Malaysia
-
 Malta
Malta
-
 Mauritius
-
 Mexico
-
 Moldova
-
 Mongolia
-
 Montenegro
-
 Morocco
-
 Mozambique
-
 Myanmar
-
 Namibia
-
 Nepal
Nepal
-
 Netherlands
-
 New Zealand
-
 Nigeria
-
 North Macedonia
-
 Norway
-
 Oman
Oman
-
 Pakistan
-
 Palestine
-
 Panama
-
 Papua New Guinea
-
 Paraguay
-
 Peru
Peru
-
 Philippines
-
 Poland
-
 Portugal
-
 Puerto Rico
-
 Qatar
Qatar
-
 Reunion
-
 Romania
-
 Rwanda
-
 Saudi Arabia
-
 Serbia
-
 Singapore
-
 Slovakia
-
 Slovenia
-
 Somalia
-
 South Africa
-
 Spain
Spain
-
 Sri Lanka
-
 Sweden
-
 Switzerland
-
 Syria
Syria
-
 Taiwan
-
 Tajikistan
-
 Tanzania
-
 Thailand
-
 Trinidad and Tobago
-
 Tunisia
-
 Turkey
-
 UAE
UAE
-
 Uganda
-
 Ukraine
-
 United Kingdom
-
United States
-
 Uruguay
-
 Uzbekistan
-
 Venezuela
-
 Vietnam
-
 Yemen
Yemen
-
 Zambia
-
 Zimbabwe
- Forex
- Crypto












