
Chainlink slides slightly facing resistance at $9.68 after significant exchange outflows: weekly review

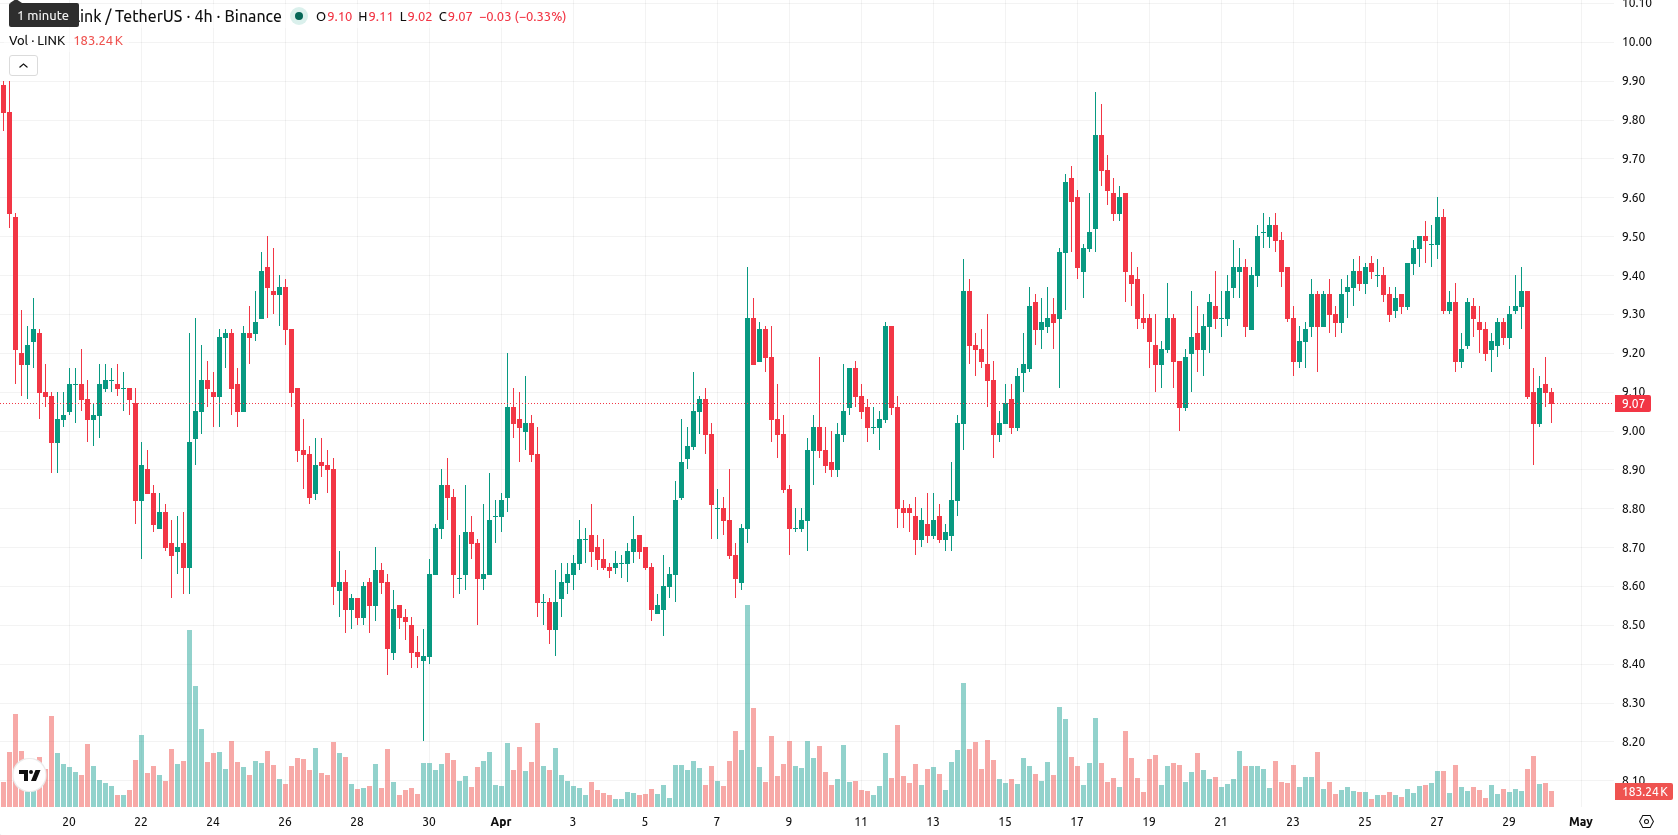
Chainlink (LINK) is trading at $9.07 after slipping $0.17 (1.73%) over the last week, reflecting continued downside pressure on the weekly chart. The asset remains below its W1 MA-20 ($10.06), MA-50 ($14,63), and MA-200 ($12.47), indicating ongoing weakness against all major moving averages.
Highlights
- Chainlink remains under sustained bearish pressure, trading below key moving averages with no clear bullish catalysts present.
- Technical indicators confirm bearish momentum, with MACD, ADX, and momentum oscillators all signaling ongoing seller control.
- LINK is expected to stay between $8.38 and $9.68 next week, with under 20% probability of an upward breakout.
Largest weekly net outflows seen as accumulation signals emerge
Chainlink saw its largest daily net exchange outflow of 2026, with 970,430 LINK valued at approximately $8.95 million withdrawn from exchanges in a single day. Analysts interpret this as a possible sign of accumulation, given the Chainlink Exchange Flow Balance stayed negative throughout April. The network also continues to support the expansion of tokenized assets and on-chain data infrastructure within the crypto ecosystem.
Bearish momentum reinforced over week with indicators and resistance levels
On the weekly timeframe, LINK is positioned firmly below all key moving averages (MA-20, MA-50, MA-200), underscoring persistent bearish momentum. The nearest dynamic resistance sits at the MA-20 ($10.06), while the Ichimoku Kijun remains far above current prices and is not a practical resistance level at this stage. Weekly support is seen at $8.38 and resistance at $9.68. Technical indicators reinforce the bearish bias: the MACD shows a strong sell, ADX signals continued weakness, the RSI is bearish, the Stochastic RSI is overbought, and Bull/Bear Power remains in oversold territory, all pointing to clear seller dominance.
Sideways to lower range expected this week as bullish signals stay absent
For the upcoming 7 days, LINK is expected to remain rangebound between $8.38 and $9.68, with weekly volatility at 7.74%. Given the absence of short-term bullish momentum or oscillator reversals and none of the four key weekly indicators turning bullish, the probability of meaningful upside is less than 20%. The baseline scenario calls for further sideways to downward movement within the defined range. Should LINK break down below $8.38, additional selling could accelerate, while a push above $9.68 would be needed to spark any relief rally — though this appears unlikely given current weekly data.
Earlier, analysts noted that Chainlink was experiencing persistent bearish momentum despite continued ecosystem growth. The latest exchange outflow data and weak technical indicators reinforce this cautious outlook, with the prevailing scenario pointing to further sideways or downside movement in the near term.


-
 Afghanistan
-
 Albania
-
 Algeria
-
 Angola
-
 Argentina
-
 Armenia
-
 Australia
-
 Austria
-
 Azerbaijan
-
 Bahamas
-
 Bahrain
-
 Bangladesh
-
 Belarus
-
 Belgium
-
 Bolivia
-
 Botswana
-
 Brazil
-
 Brunei
-
 Bulgaria
-
 Cambodia
-
 Cameroon
-
 Canada
-
 Chile
Chile
-
 China
China
-
 Colombia
-
 Congo
Congo
-
 Costa Rica
-
 Cote d'Ivoire
-
 Croatia
-
 Cuba
Cuba
-
 Cyprus
-
 Czechia
-
 DR Congo
-
 Denmark
-
 Dominican Republic
-
 Ecuador
-
 Egypt
Egypt
-
 El Salvador
-
 Estonia
-
 Eswatini
-
 Ethiopia
-
 Finland
-
 France
-
 Georgia
-
 Germany
-
 Ghana
Ghana
-
 Greece
-
 Haiti
Haiti
-
 Hong Kong
-
 Hungary
-
 India
India
-
 Indonesia
-
 Iran, Islamic republic
-
 Iraq
Iraq
-
 Ireland
-
 Israel
-
 Italy
Italy
-
 Jamaica
-
 Japan
Japan
-
 Jordan
-
 Kazakhstan
-
 Kenya
Kenya
-
 Korea
Korea
-
 Kuwait
-
 Kyrgyzstan
-
 Laos
Laos
-
 Latvia
-
 Lebanon
-
 Lesotho
-
 Libya
Libya
-
 Lithuania
-
 Luxembourg
-
 Madagascar
-
 Malaysia
-
 Malta
Malta
-
 Mauritius
-
 Mexico
-
 Moldova
-
 Mongolia
-
 Montenegro
-
 Morocco
-
 Mozambique
-
 Myanmar
-
 Namibia
-
 Nepal
Nepal
-
 Netherlands
-
 New Zealand
-
 Nigeria
-
 North Macedonia
-
 Norway
-
 Oman
Oman
-
 Pakistan
-
 Palestine
-
 Panama
-
 Papua New Guinea
-
 Paraguay
-
 Peru
Peru
-
 Philippines
-
 Poland
-
 Portugal
-
 Puerto Rico
-
 Qatar
Qatar
-
 Reunion
-
 Romania
-
 Rwanda
-
 Saudi Arabia
-
 Serbia
-
 Singapore
-
 Slovakia
-
 Slovenia
-
 Somalia
-
 South Africa
-
 Spain
Spain
-
 Sri Lanka
-
 Sweden
-
 Switzerland
-
 Syria
Syria
-
 Taiwan
-
 Tajikistan
-
 Tanzania
-
 Thailand
-
 Trinidad and Tobago
-
 Tunisia
-
 Turkey
-
 UAE
UAE
-
 Uganda
-
 Ukraine
-
 United Kingdom
-
United States
-
 Uruguay
-
 Uzbekistan
-
 Venezuela
-
 Vietnam
-
 Yemen
Yemen
-
 Zambia
-
 Zimbabwe
- Forex
- Crypto
