
VeChain edges lower, facing resistance at MA-20 on technical charts: weekly analysis

VeChain (VET) is currently trading at $0.007074, having declined $0.000197, or 2.68%, over the past week. The price remains well below its weekly MA-20 ($0.00842240), MA-50 ($0.01602356), and MA-200 ($0.02428484), confirming sustained bearish momentum and a position near the lower part of the weekly range.
 0.004903
0.00507600
0.004903
0.00507600
Highlights
- VeChain remains in a sustained bearish trend, trading below key moving averages and showing no reversal signs.
- Key momentum indicators confirm persistent selling pressure, with both MACD and ADX reflecting continued weakness.
- The likely price range for the week is $0.00653 to $0.00762, with a downside breakout increasing the risk of new long-term lows.
Persistent downside pressure as bearish signals strengthen during the week
On the weekly (W1) chart, VeChain continues to trade beneath all major moving averages, with dynamic resistance seen at the MA-20. Momentum remains negative, as both the MACD and ADX show a persistent bearish trend. The RSI and Commodity Channel Index are in the sell zone, while the Stochastic RSI is overbought, suggesting some near-term rebound risk but no clear reversal. Bull/Bear Power readings confirm mild seller dominance, and the price is contained within the lower end of the weekly range, reflecting ongoing downside pressure.
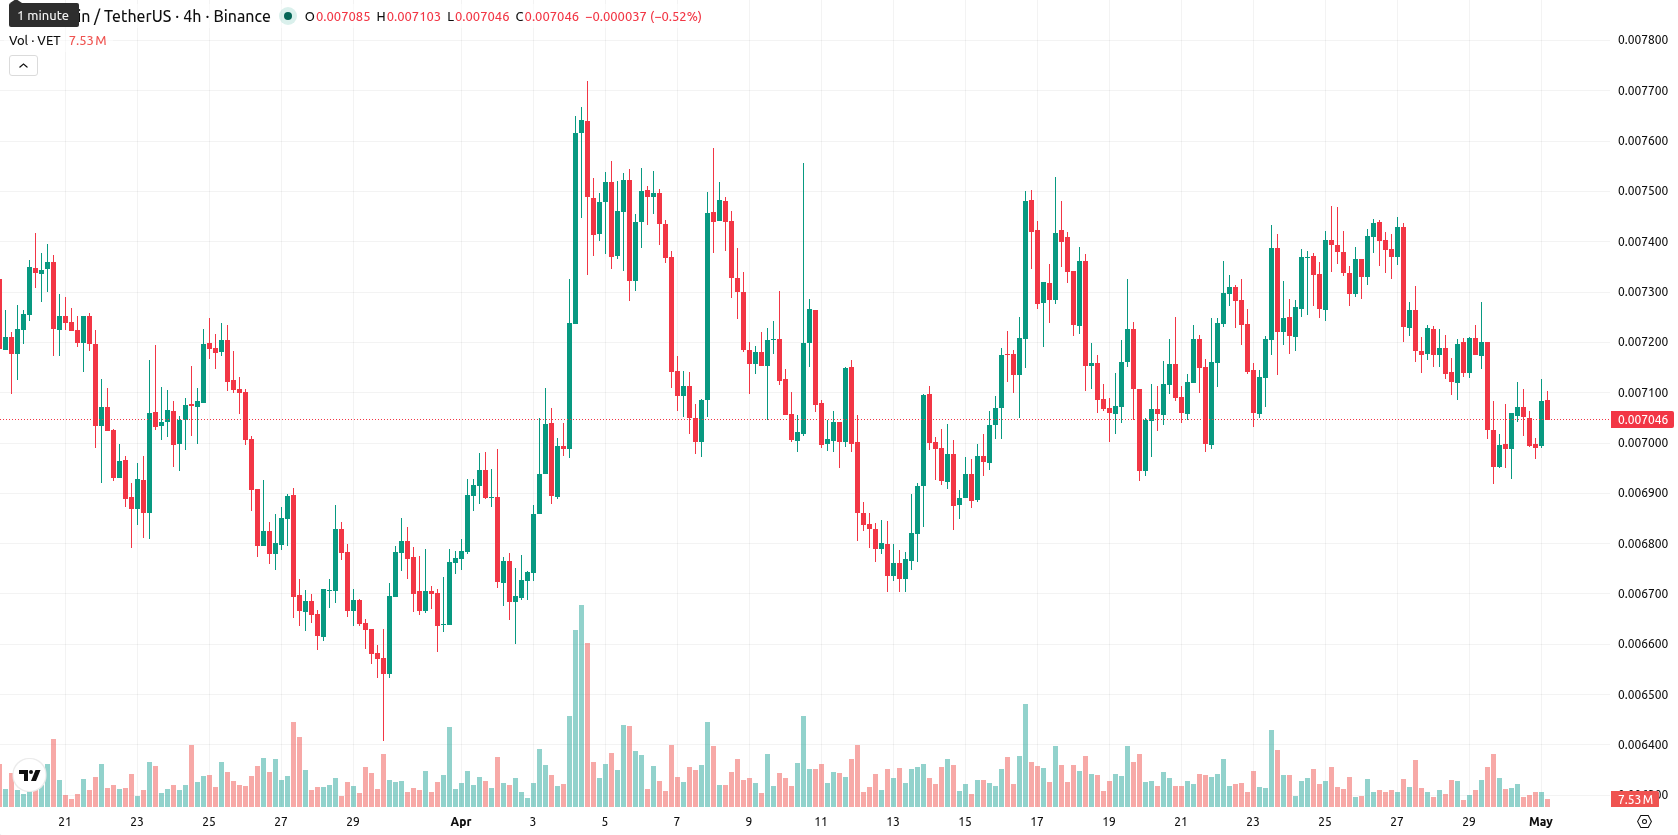
Range-bound outlook as bearish bias persists for the coming week
For the next seven days, VeChain is expected to trade within a range of $0.00653 to $0.00762, mirroring recent volatility and the prevailing bearish bias. A continued sideways-to-lower consolidation is the baseline scenario, given the lack of bullish indicator signals. Should the price break above $0.00762, minor resistance near the MA-20 could come into play, though this outcome is unlikely. If the price falls below $0.00653, a retest of long-term lows is possible, as bearish momentum persists.
Earlier, analysts noted that VeChain was maintaining a prolonged bearish technical trend with limited prospects for an immediate bullish reversal. The current analysis reinforces this outlook, emphasizing that without a decisive move above its near-term resistance, traders should remain alert for continued downside risk within the prevailing consolidation range.








-
 Afghanistan
-
 Albania
-
 Algeria
-
 Angola
-
 Argentina
-
 Armenia
-
 Australia
-
 Austria
-
 Azerbaijan
-
 Bahamas
-
 Bahrain
-
 Bangladesh
-
 Belarus
-
 Belgium
-
 Bolivia
-
 Botswana
-
 Brazil
-
 Brunei
-
 Bulgaria
-
 Cambodia
-
 Cameroon
-
 Canada
-
 Chile
Chile
-
 China
China
-
 Colombia
-
 Congo
Congo
-
 Costa Rica
-
 Cote d'Ivoire
-
 Croatia
-
 Cuba
Cuba
-
 Cyprus
-
 Czechia
-
 DR Congo
-
 Denmark
-
 Dominican Republic
-
 Ecuador
-
 Egypt
Egypt
-
 El Salvador
-
 Estonia
-
 Eswatini
-
 Ethiopia
-
 Finland
-
 France
-
 Georgia
-
 Germany
-
 Ghana
Ghana
-
 Greece
-
 Haiti
Haiti
-
 Hong Kong
-
 Hungary
-
 India
India
-
 Indonesia
-
 Iran, Islamic republic
-
 Iraq
Iraq
-
 Ireland
-
 Israel
-
 Italy
Italy
-
 Jamaica
-
 Japan
Japan
-
 Jordan
-
 Kazakhstan
-
 Kenya
Kenya
-
 Korea
Korea
-
 Kuwait
-
 Kyrgyzstan
-
 Laos
Laos
-
 Latvia
-
 Lebanon
-
 Lesotho
-
 Libya
Libya
-
 Lithuania
-
 Luxembourg
-
 Madagascar
-
 Malaysia
-
 Malta
Malta
-
 Mauritius
-
 Mexico
-
 Moldova
-
 Mongolia
-
 Montenegro
-
 Morocco
-
 Mozambique
-
 Myanmar
-
 Namibia
-
 Nepal
Nepal
-
 Netherlands
-
 New Zealand
-
 Nigeria
-
 North Macedonia
-
 Norway
-
 Oman
Oman
-
 Pakistan
-
 Palestine
-
 Panama
-
 Papua New Guinea
-
 Paraguay
-
 Peru
Peru
-
 Philippines
-
 Poland
-
 Portugal
-
 Puerto Rico
-
 Qatar
Qatar
-
 Reunion
-
 Romania
-
 Rwanda
-
 Saudi Arabia
-
 Serbia
-
 Singapore
-
 Slovakia
-
 Slovenia
-
 Somalia
-
 South Africa
-
 Spain
Spain
-
 Sri Lanka
-
 Sweden
-
 Switzerland
-
 Syria
Syria
-
 Taiwan
-
 Tajikistan
-
 Tanzania
-
 Thailand
-
 Trinidad and Tobago
-
 Tunisia
-
 Turkey
-
 UAE
UAE
-
 Uganda
-
 Ukraine
-
 United Kingdom
-
United States
-
 Uruguay
-
 Uzbekistan
-
 Venezuela
-
 Vietnam
-
 Yemen
Yemen
-
 Zambia
-
 Zimbabwe
- Forex
- Crypto











