
The Graph edges lower facing resistance at $0.0258 and oversold RSI: weekly report

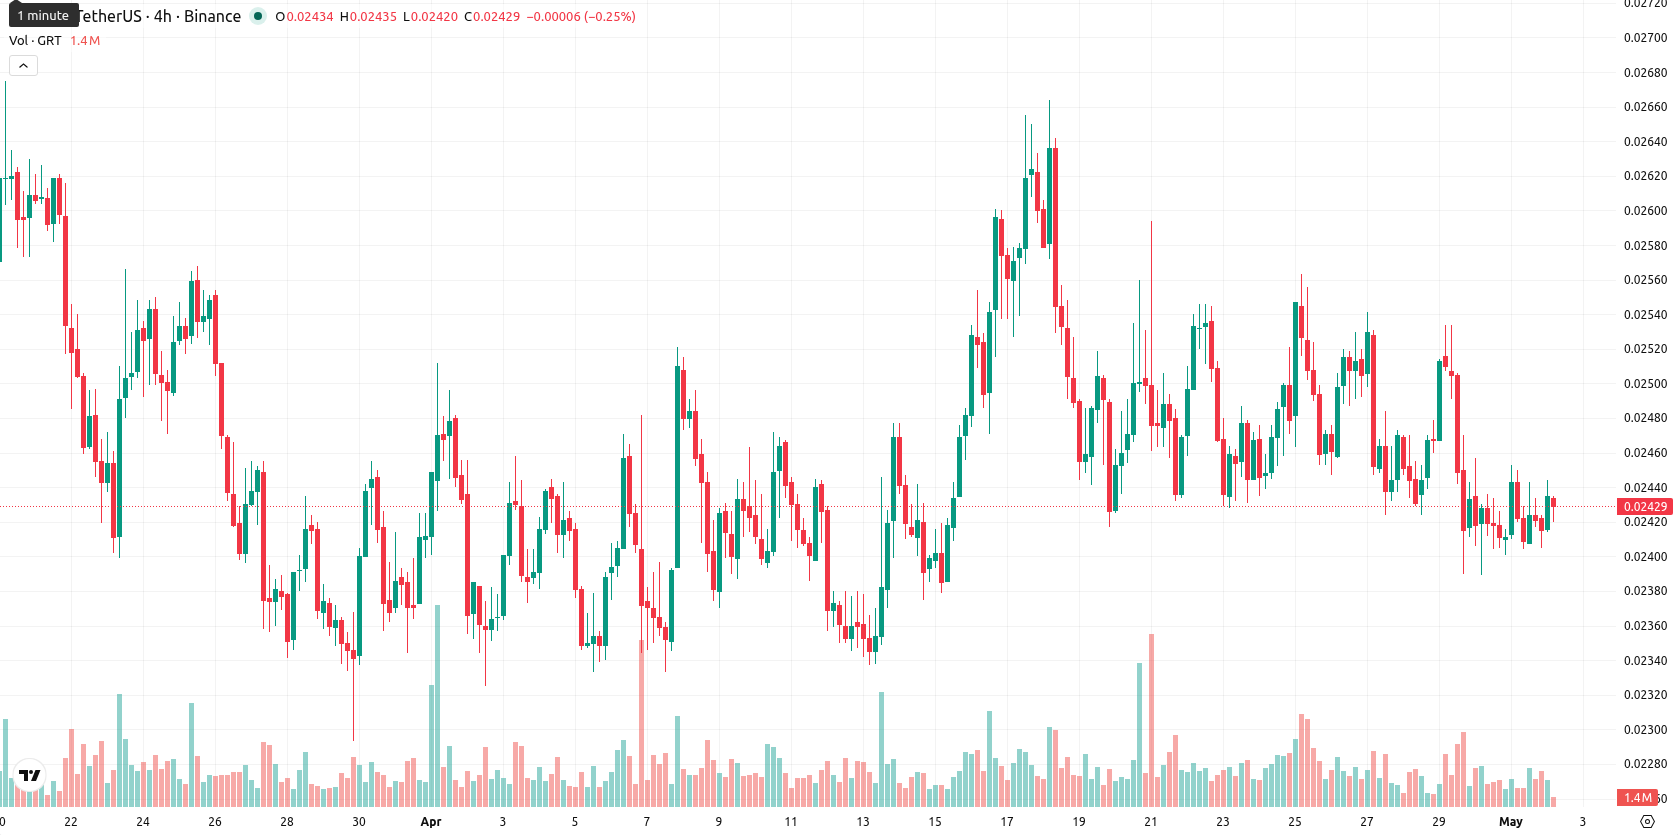
The Graph (GRT) closed the week at $0.024306, down $0.0010 or 3.93% over the past 7 days. The asset continues to trade well below its key weekly moving averages, with MA-20 at $0.02950180, MA-50 at $0.06053072, and MA-200 at $0.13049018 — a clear indication of persistent downside momentum on the weekly timeframe.
Highlights
- GRT remains in a strong bearish trend, with price trading firmly below all major weekly moving averages and lacking dynamic support.
- Momentum indicators align bearish, with sellers maintaining control despite the asset approaching oversold territory on several measures.
- The expected price range for the next week is $0.0230 to $0.0258, with further downside more likely than a rebound.
Bearish momentum strengthens as weekly signals and sellers dominate
On the weekly chart, GRT remains firmly below all major moving averages, with the nearest resistance at the MA-20. The RSI is at 29.07, nearing oversold territory, and the CCI at -64.76 also signals continued selling pressure. Weekly momentum is bearish, as highlighted by the MACD's "Strong Sell" reading, while the ADX at 26.73 confirms a solid negative trend and prevailing bearish sentiment. The Stochastic RSI is overbought, reflecting divergence against other oscillators, and both Bull Power and Bear Power indicators show sellers are firmly in control, matching this week's decline and volatility of 6.36%.
Narrow range expected as downside risk outweighs rebound potential
Looking ahead, GRT is expected to trade in a narrow range of $0.0230 to $0.0258 over the next 7 days, consistent with recent weekly volatility. The probability of a short-term rebound remains low, with less than a 20% chance of overcoming resistance, as all major weekly indicators continue to show no signs of reversal. The baseline scenario favors consolidation near current levels. Upside potential is limited — a move above $0.0258 could open the way to a quick recovery toward the MA-20 area, while a break below $0.0230 might accelerate losses and push the price toward its yearly lows.
Earlier, analysts noted that The Graph was firmly entrenched in a medium- and long-term downtrend, with sellers maintaining clear control. This week's continued alignment of technical indicators with bearish momentum reinforces that outlook, making a decisive move above the MA-20 a pivotal threshold for any potential recovery in the sessions ahead.


-
 Afghanistan
-
 Albania
-
 Algeria
-
 Angola
-
 Argentina
-
 Armenia
-
 Australia
-
 Austria
-
 Azerbaijan
-
 Bahamas
-
 Bahrain
-
 Bangladesh
-
 Belarus
-
 Belgium
-
 Bolivia
-
 Botswana
-
 Brazil
-
 Brunei
-
 Bulgaria
-
 Cambodia
-
 Cameroon
-
 Canada
-
 Chile
Chile
-
 China
China
-
 Colombia
-
 Congo
Congo
-
 Costa Rica
-
 Cote d'Ivoire
-
 Croatia
-
 Cuba
Cuba
-
 Cyprus
-
 Czechia
-
 DR Congo
-
 Denmark
-
 Dominican Republic
-
 Ecuador
-
 Egypt
Egypt
-
 El Salvador
-
 Estonia
-
 Eswatini
-
 Ethiopia
-
 Finland
-
 France
-
 Georgia
-
 Germany
-
 Ghana
Ghana
-
 Greece
-
 Haiti
Haiti
-
 Hong Kong
-
 Hungary
-
 India
India
-
 Indonesia
-
 Iran, Islamic republic
-
 Iraq
Iraq
-
 Ireland
-
 Israel
-
 Italy
Italy
-
 Jamaica
-
 Japan
Japan
-
 Jordan
-
 Kazakhstan
-
 Kenya
Kenya
-
 Korea
Korea
-
 Kuwait
-
 Kyrgyzstan
-
 Laos
Laos
-
 Latvia
-
 Lebanon
-
 Lesotho
-
 Libya
Libya
-
 Lithuania
-
 Luxembourg
-
 Madagascar
-
 Malaysia
-
 Malta
Malta
-
 Mauritius
-
 Mexico
-
 Moldova
-
 Mongolia
-
 Montenegro
-
 Morocco
-
 Mozambique
-
 Myanmar
-
 Namibia
-
 Nepal
Nepal
-
 Netherlands
-
 New Zealand
-
 Nigeria
-
 North Macedonia
-
 Norway
-
 Oman
Oman
-
 Pakistan
-
 Palestine
-
 Panama
-
 Papua New Guinea
-
 Paraguay
-
 Peru
Peru
-
 Philippines
-
 Poland
-
 Portugal
-
 Puerto Rico
-
 Qatar
Qatar
-
 Reunion
-
 Romania
-
 Rwanda
-
 Saudi Arabia
-
 Serbia
-
 Singapore
-
 Slovakia
-
 Slovenia
-
 Somalia
-
 South Africa
-
 Spain
Spain
-
 Sri Lanka
-
 Sweden
-
 Switzerland
-
 Syria
Syria
-
 Taiwan
-
 Tajikistan
-
 Tanzania
-
 Thailand
-
 Trinidad and Tobago
-
 Tunisia
-
 Turkey
-
 UAE
UAE
-
 Uganda
-
 Ukraine
-
 United Kingdom
-
United States
-
 Uruguay
-
 Uzbekistan
-
 Venezuela
-
 Vietnam
-
 Yemen
Yemen
-
 Zambia
-
 Zimbabwe
- Forex
- Crypto
