
GRT consolidates at the bottom of its seven-day range as volatility remains elevated: weekly review

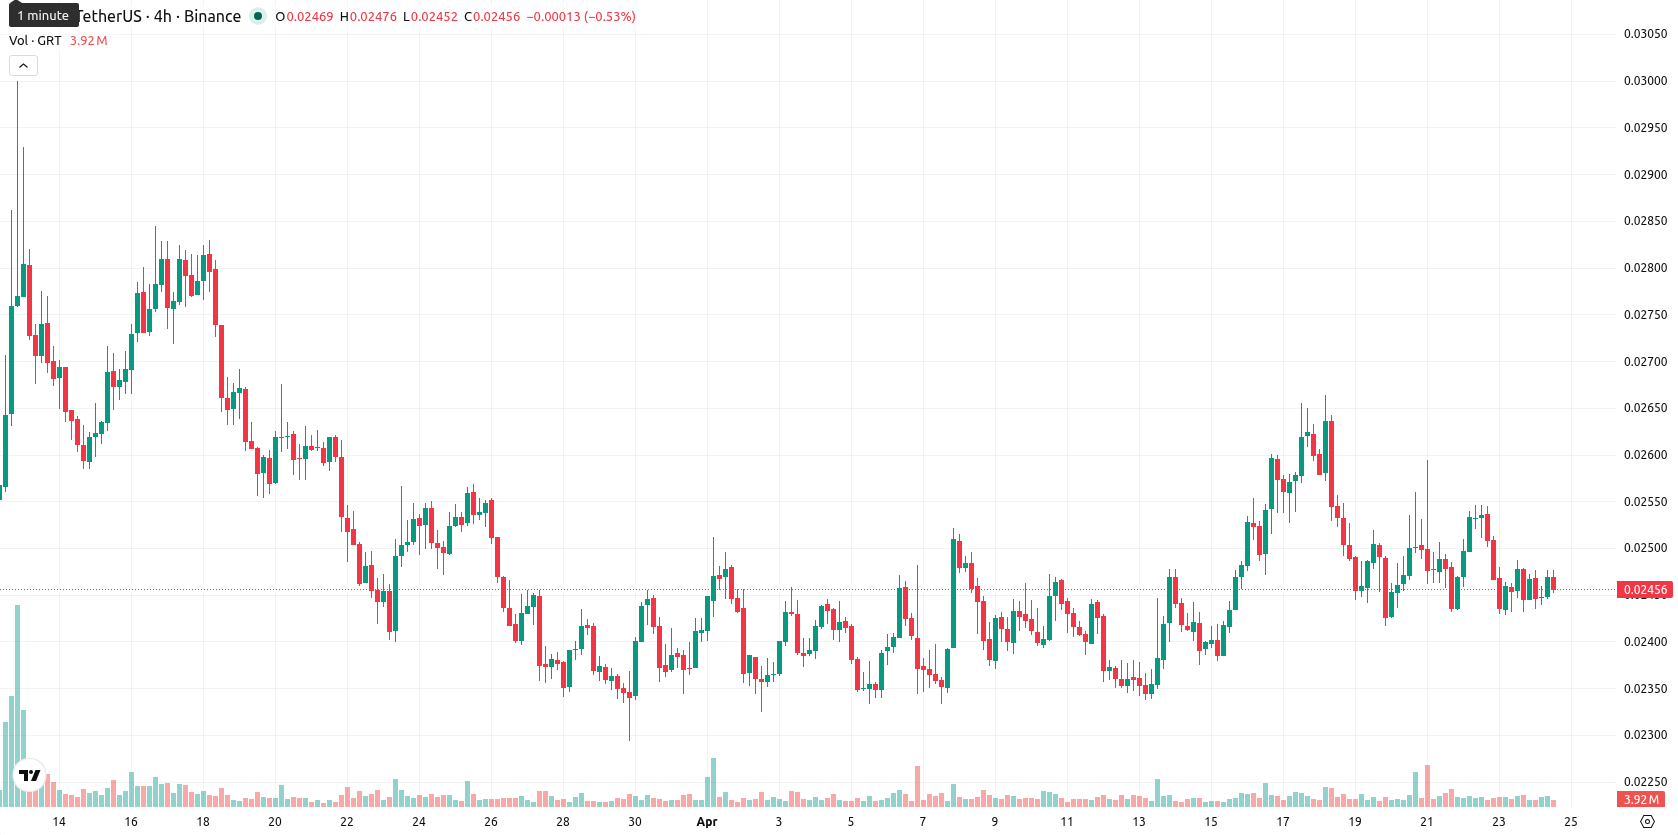
The Graph (GRT) closed the week at the lower end of its recent weekly range, having fallen $0.0017 (6.57%) over the last seven days. The asset is trading well below its 20-week ($0.03027070), 50-week ($0.06232728), and 200-week ($0.13083982) moving averages, underscoring persistent medium- and long-term downside momentum.
Highlights
- GRT trades below all major moving averages, confirming sustained downward momentum in both medium- and long-term trends.
- Momentum and trend indicators signal strong selling pressure, with negative MACD, ADX, and Bull/Bear Power readings dominating.
- Expected price range for the next week is $0.0221 to $0.0271, with less than 20% probability of a bullish reversal.
Downtrend accelerates over the week as sell signals and volatility align
Weekly technical signals remain firmly negative for GRT. The weekly MACD indicates a strong sell and the ADX points to continued dominance by sellers, while the RSI and CCI are both oversold. Despite a short-term divergence flagged by the overbought Stochastic RSI, negative Bull/Bear Power and broad oscillator readings reinforce the active downtrend, with the price hovering near the bottom of the weekly range and volatility at 10.22%.
Further downside favored this week as technicals limit breakout potential
Looking ahead over the next seven days, the expected trading range for GRT is $0.0221 to $0.0271. With none of the four major technical indicators signaling a buy or strong buy, the probability of an upward move remains below 20%, making further declines likely. The baseline forecast calls for consolidation within this range; a bullish scenario would require a break above $0.0271, which is unlikely under current conditions, while prolonged negative momentum could trigger a move below $0.0221.
Earlier, analysts noted that The Graph remained under pronounced medium- and long-term bearish pressure, with sellers maintaining firm control. This week's sustained negative momentum and deepening oversold signals reinforce the prevailing downtrend, making a decisive breach below the $0.0221 support level the key risk to monitor in the coming days.


-
 Afghanistan
-
 Albania
-
 Algeria
-
 Angola
-
 Argentina
-
 Armenia
-
 Australia
-
 Austria
-
 Azerbaijan
-
 Bahamas
-
 Bahrain
-
 Bangladesh
-
 Belarus
-
 Belgium
-
 Bolivia
-
 Botswana
-
 Brazil
-
 Brunei
-
 Bulgaria
-
 Cambodia
-
 Cameroon
-
 Canada
-
 Chile
Chile
-
 China
China
-
 Colombia
-
 Congo
Congo
-
 Costa Rica
-
 Cote d'Ivoire
-
 Croatia
-
 Cuba
Cuba
-
 Cyprus
-
 Czechia
-
 DR Congo
-
 Denmark
-
 Dominican Republic
-
 Ecuador
-
 Egypt
Egypt
-
 El Salvador
-
 Estonia
-
 Eswatini
-
 Ethiopia
-
 Finland
-
 France
-
 Georgia
-
 Germany
-
 Ghana
Ghana
-
 Greece
-
 Haiti
Haiti
-
 Hong Kong
-
 Hungary
-
 India
India
-
 Indonesia
-
 Iran, Islamic republic
-
 Iraq
Iraq
-
 Ireland
-
 Israel
-
 Italy
Italy
-
 Jamaica
-
 Japan
Japan
-
 Jordan
-
 Kazakhstan
-
 Kenya
Kenya
-
 Korea
Korea
-
 Kuwait
-
 Kyrgyzstan
-
 Laos
Laos
-
 Latvia
-
 Lebanon
-
 Lesotho
-
 Libya
Libya
-
 Lithuania
-
 Luxembourg
-
 Madagascar
-
 Malaysia
-
 Malta
Malta
-
 Mauritius
-
 Mexico
-
 Moldova
-
 Mongolia
-
 Montenegro
-
 Morocco
-
 Mozambique
-
 Myanmar
-
 Namibia
-
 Nepal
Nepal
-
 Netherlands
-
 New Zealand
-
 Nigeria
-
 North Macedonia
-
 Norway
-
 Oman
Oman
-
 Pakistan
-
 Palestine
-
 Panama
-
 Papua New Guinea
-
 Paraguay
-
 Peru
Peru
-
 Philippines
-
 Poland
-
 Portugal
-
 Puerto Rico
-
 Qatar
Qatar
-
 Reunion
-
 Romania
-
 Rwanda
-
 Saudi Arabia
-
 Serbia
-
 Singapore
-
 Slovakia
-
 Slovenia
-
 Somalia
-
 South Africa
-
 Spain
Spain
-
 Sri Lanka
-
 Sweden
-
 Switzerland
-
 Syria
Syria
-
 Taiwan
-
 Tajikistan
-
 Tanzania
-
 Thailand
-
 Trinidad and Tobago
-
 Tunisia
-
 Turkey
-
 UAE
UAE
-
 Uganda
-
 Ukraine
-
 United Kingdom
-
United States
-
 Uruguay
-
 Uzbekistan
-
 Venezuela
-
 Vietnam
-
 Yemen
Yemen
-
 Zambia
-
 Zimbabwe
- Forex
- Crypto
