
Quant trades at lower range as sideways movement expected within narrow seven-day band: weekly review

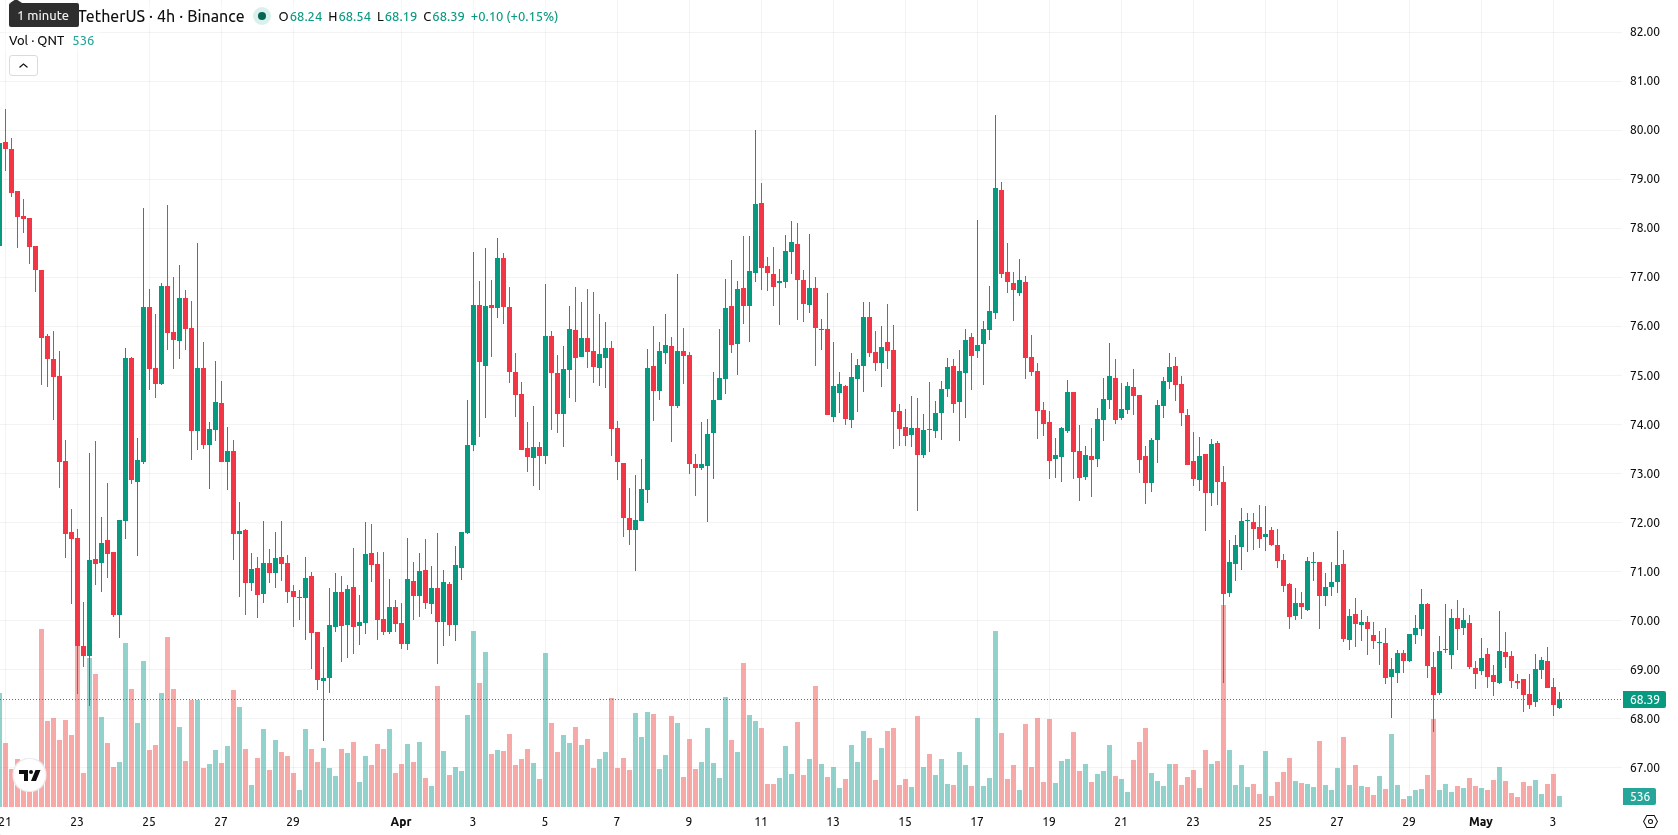
Quant (QNT) is trading at $68.39, having declined $2.51 or 3.46% over the last week, and now sits below its weekly MA-20 at $70.93, MA-50 at $88.30, and MA-200 at $99.64. The asset is positioned at the lower end of its weekly range, with no significant dynamic support nearby except the MA-20, highlighting continued bearish momentum.
Highlights
- Quant trades below key moving averages with persistent selling pressure and no major long-term support nearby.
- Momentum indicators confirm a dominant bearish bias, with weak trend strength and no buy signals from major oscillators.
- For the coming week, QNT is expected to range between $67.80 and $69.90, with greater downside risk if support breaks.
Technical signals weaken over the week as sellers keep control
Weekly technical analysis indicates persistent downward pressure, with the MACD on a strong sell and ADX suggesting trend weakness. The RSI on the weekly chart remains in sell territory, while Stochastic RSI and CCI both register neutral, showing no clear indication of overbought or oversold conditions. Bull/Bear Power reads oversold, suggesting sellers continue to dominate the market. Weekly volatility is measured at 6.04%, with support near recent lows and resistance marked at the MA-20 around $70.93.
Downside bias likely next week amid weak reversal signals
Over the next 7 days, the expected trading range for QNT is $67.80 to $69.90, with the downside bias likely to persist given current weekly momentum readings. The most probable scenario is sideways movement near recent lows, with a breakout above $69.90 needed to trigger a minor relief rally. A move below $67.80 could extend the decline toward the yearly low, as no key indicator currently signals a reversal.
Previously it was reported that Quant remained under sustained bearish pressure, with technicals favoring a continued lack of bullish momentum. The latest indicators reinforce this view, suggesting traders should closely monitor downside risk, particularly if support near $67.80 fails to hold in the coming week.


-
 Afghanistan
-
 Albania
-
 Algeria
-
 Angola
-
 Argentina
-
 Armenia
-
 Australia
-
 Austria
-
 Azerbaijan
-
 Bahamas
-
 Bahrain
-
 Bangladesh
-
 Belarus
-
 Belgium
-
 Bolivia
-
 Botswana
-
 Brazil
-
 Brunei
-
 Bulgaria
-
 Cambodia
-
 Cameroon
-
 Canada
-
 Chile
Chile
-
 China
China
-
 Colombia
-
 Congo
Congo
-
 Costa Rica
-
 Cote d'Ivoire
-
 Croatia
-
 Cuba
Cuba
-
 Cyprus
-
 Czechia
-
 DR Congo
-
 Denmark
-
 Dominican Republic
-
 Ecuador
-
 Egypt
Egypt
-
 El Salvador
-
 Estonia
-
 Eswatini
-
 Ethiopia
-
 Finland
-
 France
-
 Georgia
-
 Germany
-
 Ghana
Ghana
-
 Greece
-
 Haiti
Haiti
-
 Hong Kong
-
 Hungary
-
 India
India
-
 Indonesia
-
 Iran, Islamic republic
-
 Iraq
Iraq
-
 Ireland
-
 Israel
-
 Italy
Italy
-
 Jamaica
-
 Japan
Japan
-
 Jordan
-
 Kazakhstan
-
 Kenya
Kenya
-
 Korea
Korea
-
 Kuwait
-
 Kyrgyzstan
-
 Laos
Laos
-
 Latvia
-
 Lebanon
-
 Lesotho
-
 Libya
Libya
-
 Lithuania
-
 Luxembourg
-
 Madagascar
-
 Malaysia
-
 Malta
Malta
-
 Mauritius
-
 Mexico
-
 Moldova
-
 Mongolia
-
 Montenegro
-
 Morocco
-
 Mozambique
-
 Myanmar
-
 Namibia
-
 Nepal
Nepal
-
 Netherlands
-
 New Zealand
-
 Nigeria
-
 North Macedonia
-
 Norway
-
 Oman
Oman
-
 Pakistan
-
 Palestine
-
 Panama
-
 Papua New Guinea
-
 Paraguay
-
 Peru
Peru
-
 Philippines
-
 Poland
-
 Portugal
-
 Puerto Rico
-
 Qatar
Qatar
-
 Reunion
-
 Romania
-
 Rwanda
-
 Saudi Arabia
-
 Serbia
-
 Singapore
-
 Slovakia
-
 Slovenia
-
 Somalia
-
 South Africa
-
 Spain
Spain
-
 Sri Lanka
-
 Sweden
-
 Switzerland
-
 Syria
Syria
-
 Taiwan
-
 Tajikistan
-
 Tanzania
-
 Thailand
-
 Trinidad and Tobago
-
 Tunisia
-
 Turkey
-
 UAE
UAE
-
 Uganda
-
 Ukraine
-
 United Kingdom
-
United States
-
 Uruguay
-
 Uzbekistan
-
 Venezuela
-
 Vietnam
-
 Yemen
Yemen
-
 Zambia
-
 Zimbabwe
- Forex
- Crypto
