
QNT edges down with MACD flashing strong sell signal: weekly forecast

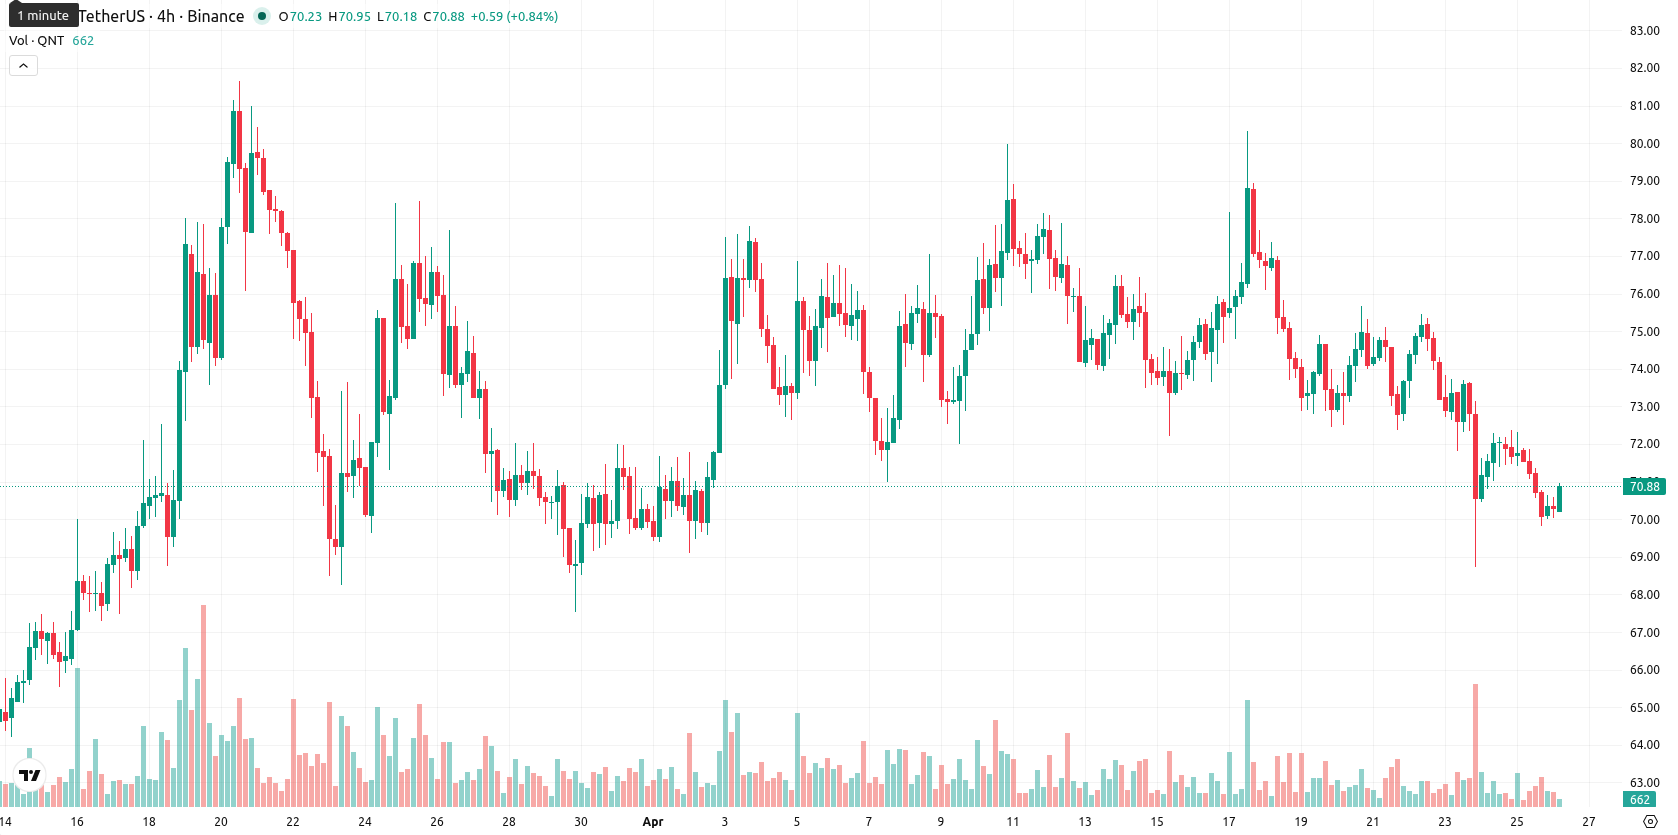
Quant (QNT) is currently trading at $70.85 after a weekly decline of $2.31, or 3.16%. The price sits just below the weekly MA-20 at $71.297, notably under the MA-50 at $88.85 and the MA-200 at $99.57, reflecting continuing pressure from sellers and a lack of medium- or long-term bullish signals.
Highlights
- QNT remains below key moving averages, signaling persistent seller dominance and no bullish confirmation in the near term.
- Momentum and trend indicators support a bearish outlook, with MACD showing strong sell and ADX indicating a weak trend.
- Expected price range for the next week is $67.00 to $78.00, with further downside favored unless $78.00 is broken conclusively.
Bearish bias holds as technicals weaken and volatility persists
On the weekly chart, QNT continues to trade below all key moving averages, with the MA-20 now acting as nearby dynamic resistance. Technical indicators confirm a bearish bias: the MACD issues a Strong Sell, the ADX trend is weak, and the RSI remains in Sell territory, while momentum oscillators such as the Stochastic RSI and CCI are neutral. Bulls lack control, and volatility over the past week was 10.10%, with the price remaining in the lower part of the week’s range.
Sideways trading likely as breakout risk and bearish signals persist
For the upcoming 7 days, QNT is expected to remain within a $67.00 to $78.00 range, based on weekly volatility and persistent bearish signals. The probability of a move above $78.00 is low (less than 20%), while a deeper slide below $67.00 is more likely if selling pressure persists. The base scenario calls for continued sideways consolidation unless a decisive breakout occurs.
Previously it was reported that Quant was consolidating within a range, with mixed technical signals and a bias toward bearish outcomes. The latest price action and indicator shifts confirm a continued lack of bullish momentum, making a close watch on potential downside moves below $67.00 prudent for traders navigating the prevailing consolidation scenario.


-
 Afghanistan
-
 Albania
-
 Algeria
-
 Angola
-
 Argentina
-
 Armenia
-
 Australia
-
 Austria
-
 Azerbaijan
-
 Bahamas
-
 Bahrain
-
 Bangladesh
-
 Belarus
-
 Belgium
-
 Bolivia
-
 Botswana
-
 Brazil
-
 Brunei
-
 Bulgaria
-
 Cambodia
-
 Cameroon
-
 Canada
-
 Chile
Chile
-
 China
China
-
 Colombia
-
 Congo
Congo
-
 Costa Rica
-
 Cote d'Ivoire
-
 Croatia
-
 Cuba
Cuba
-
 Cyprus
-
 Czechia
-
 DR Congo
-
 Denmark
-
 Dominican Republic
-
 Ecuador
-
 Egypt
Egypt
-
 El Salvador
-
 Estonia
-
 Eswatini
-
 Ethiopia
-
 Finland
-
 France
-
 Georgia
-
 Germany
-
 Ghana
Ghana
-
 Greece
-
 Haiti
Haiti
-
 Hong Kong
-
 Hungary
-
 India
India
-
 Indonesia
-
 Iran, Islamic republic
-
 Iraq
Iraq
-
 Ireland
-
 Israel
-
 Italy
Italy
-
 Jamaica
-
 Japan
Japan
-
 Jordan
-
 Kazakhstan
-
 Kenya
Kenya
-
 Korea
Korea
-
 Kuwait
-
 Kyrgyzstan
-
 Laos
Laos
-
 Latvia
-
 Lebanon
-
 Lesotho
-
 Libya
Libya
-
 Lithuania
-
 Luxembourg
-
 Madagascar
-
 Malaysia
-
 Malta
Malta
-
 Mauritius
-
 Mexico
-
 Moldova
-
 Mongolia
-
 Montenegro
-
 Morocco
-
 Mozambique
-
 Myanmar
-
 Namibia
-
 Nepal
Nepal
-
 Netherlands
-
 New Zealand
-
 Nigeria
-
 North Macedonia
-
 Norway
-
 Oman
Oman
-
 Pakistan
-
 Palestine
-
 Panama
-
 Papua New Guinea
-
 Paraguay
-
 Peru
Peru
-
 Philippines
-
 Poland
-
 Portugal
-
 Puerto Rico
-
 Qatar
Qatar
-
 Reunion
-
 Romania
-
 Rwanda
-
 Saudi Arabia
-
 Serbia
-
 Singapore
-
 Slovakia
-
 Slovenia
-
 Somalia
-
 South Africa
-
 Spain
Spain
-
 Sri Lanka
-
 Sweden
-
 Switzerland
-
 Syria
Syria
-
 Taiwan
-
 Tajikistan
-
 Tanzania
-
 Thailand
-
 Trinidad and Tobago
-
 Tunisia
-
 Turkey
-
 UAE
UAE
-
 Uganda
-
 Ukraine
-
 United Kingdom
-
United States
-
 Uruguay
-
 Uzbekistan
-
 Venezuela
-
 Vietnam
-
 Yemen
Yemen
-
 Zambia
-
 Zimbabwe
- Forex
- Crypto
