
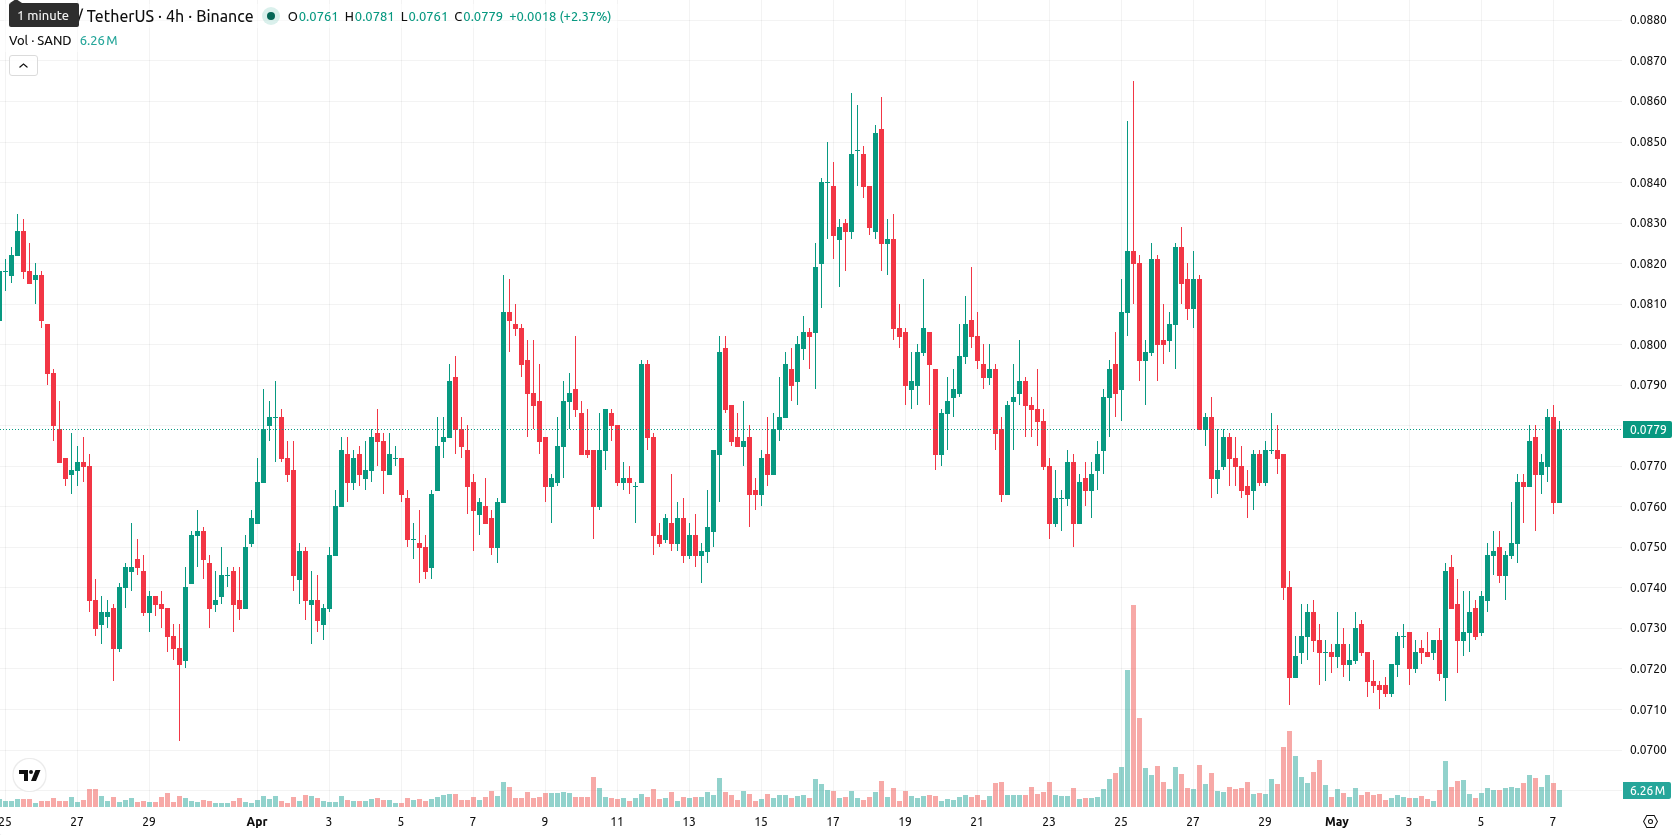
Sandbox trades up amid upside capped by nearby resistance at $0.0787

Sandbox (SAND) is trading at $0.0773, rising 1.58% on the day. The price sits just above its short-term averages yet remains subject to medium-term resistance and longer-term bearish pressure.
Highlights
- SAND price action remains rangebound, constrained by near-term resistance and long-term bearish pressure from higher timeframes.
- Momentum indicators are mixed, with short-term signals showing mild buyer activity but weekly charts confirming a strong bearish bias.
- Expected trading range for the next five days is $0.0750 to $0.0800, with a breakout above $0.0787 required for upside and risk skewed to further declines.
Sideways consolidation as key resistance and overbought signals converge
On the technical front, SAND trades just above its MA-20 ($0.0768), but slightly below the MA-50 ($0.0775) and well beneath the MA-200 ($0.1184). The Ichimoku Kijun at $0.0787 is the immediate resistance. Today’s session began with a modest gap up from the prior close of $0.0761 to an open of $0.0783, and the asset is consolidating between $0.0759 and $0.0783 amid low volatility. The D1 MACD signals a strong sell, while the ADX is neutral, indicating an indecisive trend. RSI registers at 52, consistent with mild buyer interest, though the Stoch RSI at 82 shows overbought conditions and CCI remains neutral. BBP indicates strong buyer dominance intraday, and Awesome Oscillator values are neutral.
Limited upside as range-bound trade and bearish bias persist
Over the next five trading days, price action is likely to remain within a $0.0750–$0.0800 band, aligning with typical volatility relative to current levels. The chance of a price increase is low (under 20%), with weekly timeframe indicators showing ongoing bearish signals. The baseline scenario points to sideways trading in the established corridor. A bullish breakout requires clearing the $0.0787 resistance, while a bearish move below $0.0750 could occur if sellers regain control.
Earlier, analysts noted that persistent selling pressure kept Sandbox (SAND) in a broadly bearish trend, with little evidence of a near-term reversal. The latest session's ability to hold just above short-term averages offers a tentative sign of stabilization, but traders should watch the $0.0787 resistance as a critical threshold for any potential bullish shift in the coming days.


Latest Sandbox News


-
 Afghanistan
-
 Albania
-
 Algeria
-
 Angola
-
 Argentina
-
 Armenia
-
 Australia
-
 Austria
-
 Azerbaijan
-
 Bahamas
-
 Bahrain
-
 Bangladesh
-
 Belarus
-
 Belgium
-
 Bolivia
-
 Botswana
-
 Brazil
-
 Brunei
-
 Bulgaria
-
 Cambodia
-
 Cameroon
-
 Canada
-
 Chile
Chile
-
 China
China
-
 Colombia
-
 Congo
Congo
-
 Costa Rica
-
 Cote d'Ivoire
-
 Croatia
-
 Cuba
Cuba
-
 Cyprus
-
 Czechia
-
 DR Congo
-
 Denmark
-
 Dominican Republic
-
 Ecuador
-
 Egypt
Egypt
-
 El Salvador
-
 Estonia
-
 Eswatini
-
 Ethiopia
-
 Finland
-
 France
-
 Georgia
-
 Germany
-
 Ghana
Ghana
-
 Greece
-
 Haiti
Haiti
-
 Hong Kong
-
 Hungary
-
 India
India
-
 Indonesia
-
 Iran, Islamic republic
-
 Iraq
Iraq
-
 Ireland
-
 Israel
-
 Italy
Italy
-
 Jamaica
-
 Japan
Japan
-
 Jordan
-
 Kazakhstan
-
 Kenya
Kenya
-
 Korea
Korea
-
 Kuwait
-
 Kyrgyzstan
-
 Laos
Laos
-
 Latvia
-
 Lebanon
-
 Lesotho
-
 Libya
Libya
-
 Lithuania
-
 Luxembourg
-
 Madagascar
-
 Malaysia
-
 Malta
Malta
-
 Mauritius
-
 Mexico
-
 Moldova
-
 Mongolia
-
 Montenegro
-
 Morocco
-
 Mozambique
-
 Myanmar
-
 Namibia
-
 Nepal
Nepal
-
 Netherlands
-
 New Zealand
-
 Nigeria
-
 North Macedonia
-
 Norway
-
 Oman
Oman
-
 Pakistan
-
 Palestine
-
 Panama
-
 Papua New Guinea
-
 Paraguay
-
 Peru
Peru
-
 Philippines
-
 Poland
-
 Portugal
-
 Puerto Rico
-
 Qatar
Qatar
-
 Reunion
-
 Romania
-
 Rwanda
-
 Saudi Arabia
-
 Serbia
-
 Singapore
-
 Slovakia
-
 Slovenia
-
 Somalia
-
 South Africa
-
 Spain
Spain
-
 Sri Lanka
-
 Sweden
-
 Switzerland
-
 Syria
Syria
-
 Taiwan
-
 Tajikistan
-
 Tanzania
-
 Thailand
-
 Trinidad and Tobago
-
 Tunisia
-
 Turkey
-
 UAE
UAE
-
 Uganda
-
 Ukraine
-
 United Kingdom
-
United States
-
 Uruguay
-
 Uzbekistan
-
 Venezuela
-
 Vietnam
-
 Yemen
Yemen
-
 Zambia
-
 Zimbabwe
- Forex
- Crypto
