
Stacks consolidates near $0.2645 as MACD momentum stays bearish: weekly review

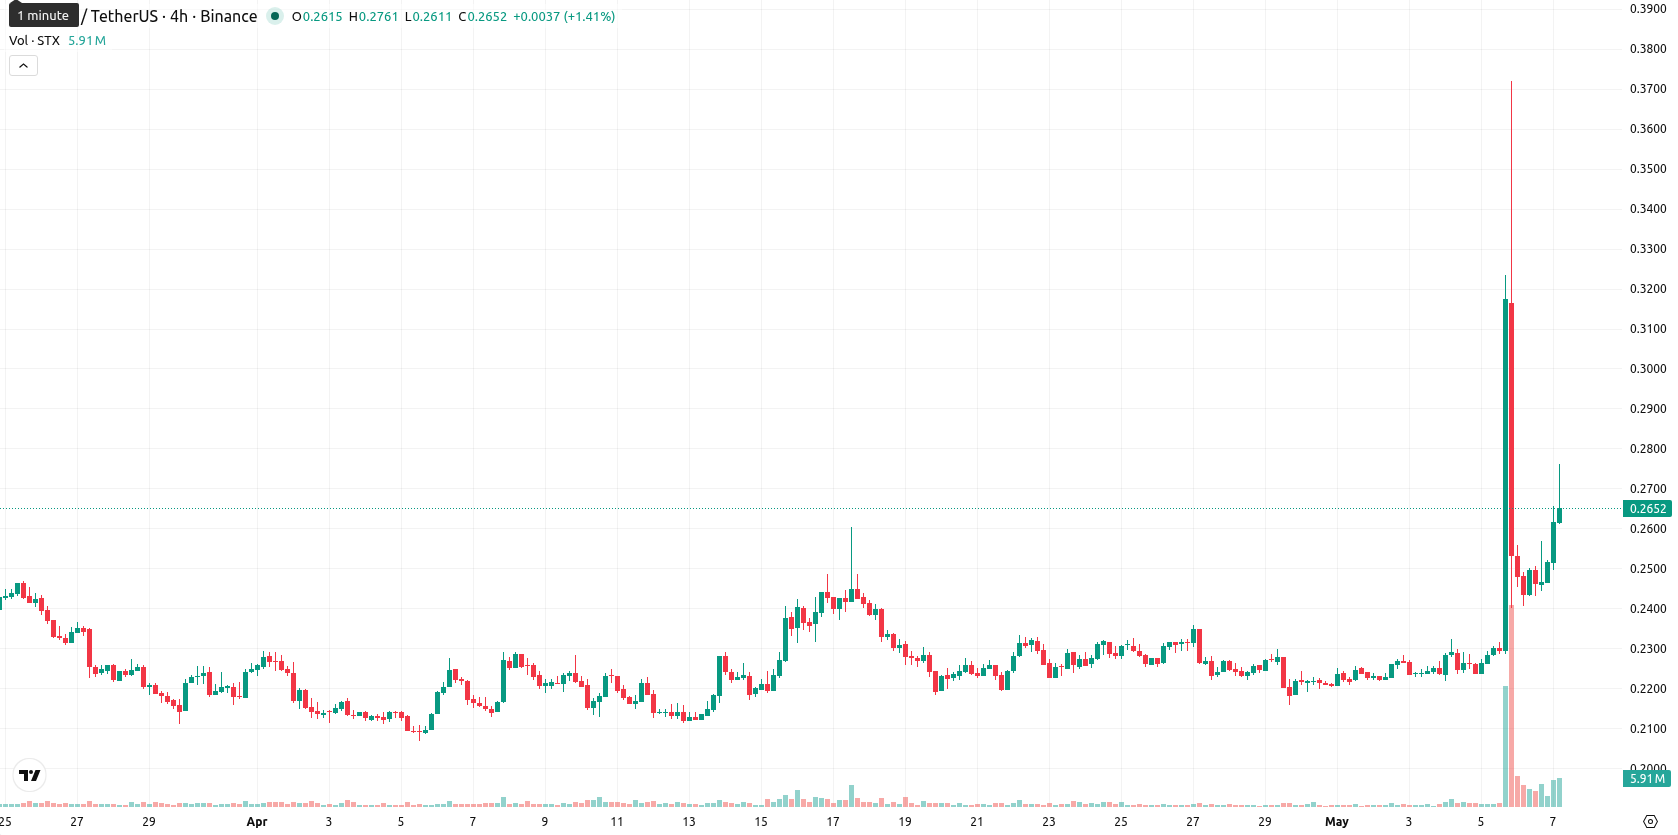
Stacks (STX) is currently trading at $0.2643, marking a weekly gain of $0.0436 or 19.80%. The asset is positioned just above its weekly MA-20 at $0.2610 but remains well below both the MA-50 at $0.4450 and MA-200 at $0.9489, indicating a short-term rebound within a broader medium- and long-term bearish context.
Highlights
- STX is consolidating just above short-term support but remains under significant medium- and long-term downward pressure.
- Momentum signals are mixed, with ongoing bearish MACD, weak trend strength, and exhaustion risk following a recent 19.8% rebound.
- Expected seven-day trading range is $0.2530 to $0.2760, with a higher likelihood of downside move barring renewed momentum.
Mixed momentum signals as weekly technicals flag limited upside
On the weekly chart, STX is consolidating above the MA-20 but stays firmly beneath longer-term moving averages, highlighting persistent overhead resistance. Momentum signals are mixed: the MACD remains bearish and ADX reads as weak, so underlying trend momentum is low. RSI points toward a neutral-sell bias, and the overbought Stochastic RSI suggests that the recent rally may be losing steam. Weekly volatility is high at 37.71%, with bull/bear power slightly favoring buyers, but with signals from oscillators and trend tools not in alignment.
Low breakout odds as indicators point to consolidation risk next week
In the coming 7 days, STX is likely to fluctuate in a range of $0.2530 to $0.2760, centering near $0.2645. Based on the current weekly indicators, a further upside breakout has a low probability (under 20%) unless buyers regain momentum and price moves above $0.2760. The baseline scenario is for continued consolidation within these bands, but a break below $0.2530 could open the way for additional downside. All four main weekly indicators suggest caution and a higher likelihood of a pullback than a sustained advance.
Earlier, analysts noted that Stacks was displaying short-term bullish momentum but faced limited prospects for further upside amid signals of impending consolidation. The persistence of choppy trading and mixed momentum readings in the current week underscores the importance of monitoring the $0.2760 threshold, as a decisive move above this level could shift sentiment and suggest renewed upside potential.


-
 Afghanistan
-
 Albania
-
 Algeria
-
 Angola
-
 Argentina
-
 Armenia
-
 Australia
-
 Austria
-
 Azerbaijan
-
 Bahamas
-
 Bahrain
-
 Bangladesh
-
 Belarus
-
 Belgium
-
 Bolivia
-
 Botswana
-
 Brazil
-
 Brunei
-
 Bulgaria
-
 Cambodia
-
 Cameroon
-
 Canada
-
 Chile
Chile
-
 China
China
-
 Colombia
-
 Congo
Congo
-
 Costa Rica
-
 Cote d'Ivoire
-
 Croatia
-
 Cuba
Cuba
-
 Cyprus
-
 Czechia
-
 DR Congo
-
 Denmark
-
 Dominican Republic
-
 Ecuador
-
 Egypt
Egypt
-
 El Salvador
-
 Estonia
-
 Eswatini
-
 Ethiopia
-
 Finland
-
 France
-
 Georgia
-
 Germany
-
 Ghana
Ghana
-
 Greece
-
 Haiti
Haiti
-
 Hong Kong
-
 Hungary
-
 India
India
-
 Indonesia
-
 Iran, Islamic republic
-
 Iraq
Iraq
-
 Ireland
-
 Israel
-
 Italy
Italy
-
 Jamaica
-
 Japan
Japan
-
 Jordan
-
 Kazakhstan
-
 Kenya
Kenya
-
 Korea
Korea
-
 Kuwait
-
 Kyrgyzstan
-
 Laos
Laos
-
 Latvia
-
 Lebanon
-
 Lesotho
-
 Libya
Libya
-
 Lithuania
-
 Luxembourg
-
 Madagascar
-
 Malaysia
-
 Malta
Malta
-
 Mauritius
-
 Mexico
-
 Moldova
-
 Mongolia
-
 Montenegro
-
 Morocco
-
 Mozambique
-
 Myanmar
-
 Namibia
-
 Nepal
Nepal
-
 Netherlands
-
 New Zealand
-
 Nigeria
-
 North Macedonia
-
 Norway
-
 Oman
Oman
-
 Pakistan
-
 Palestine
-
 Panama
-
 Papua New Guinea
-
 Paraguay
-
 Peru
Peru
-
 Philippines
-
 Poland
-
 Portugal
-
 Puerto Rico
-
 Qatar
Qatar
-
 Reunion
-
 Romania
-
 Rwanda
-
 Saudi Arabia
-
 Serbia
-
 Singapore
-
 Slovakia
-
 Slovenia
-
 Somalia
-
 South Africa
-
 Spain
Spain
-
 Sri Lanka
-
 Sweden
-
 Switzerland
-
 Syria
Syria
-
 Taiwan
-
 Tajikistan
-
 Tanzania
-
 Thailand
-
 Trinidad and Tobago
-
 Tunisia
-
 Turkey
-
 UAE
UAE
-
 Uganda
-
 Ukraine
-
 United Kingdom
-
United States
-
 Uruguay
-
 Uzbekistan
-
 Venezuela
-
 Vietnam
-
 Yemen
Yemen
-
 Zambia
-
 Zimbabwe
- Forex
- Crypto
