
-1.10% for Ethereum as spot Ethereum ETF net outflows curb institutional flows

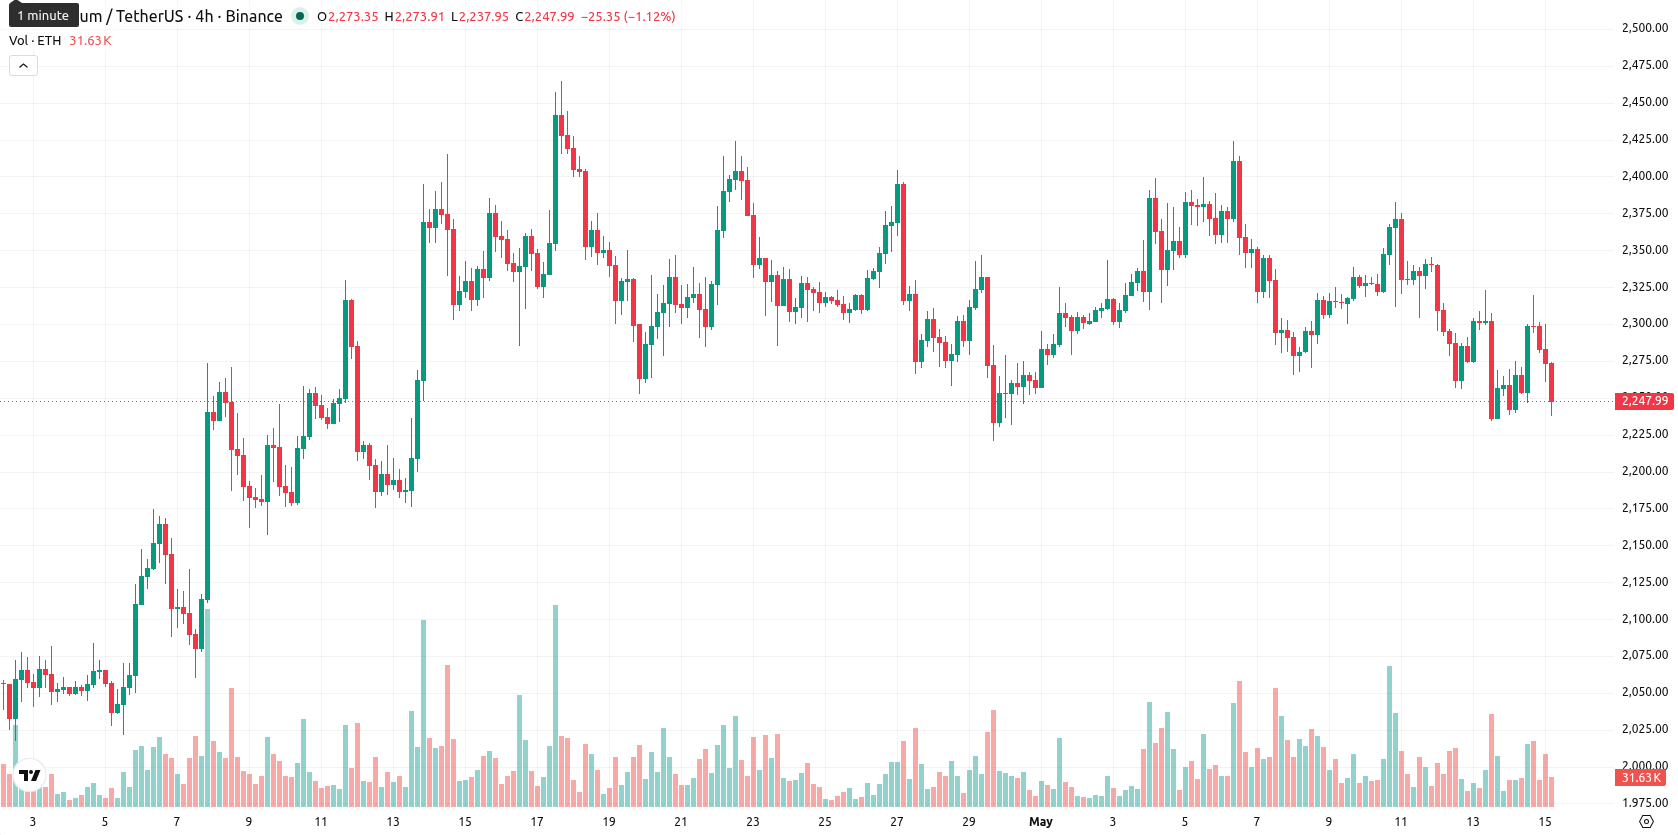
Ethereum (ETH) is trading at $2,245.01, down 1.10% on the day, and remains below its key moving averages, reflecting ongoing bearish pressure in the short term.
Highlights
- Spot Ethereum ETFs recorded $183 million in net outflows this week, reducing institutional liquidity and amplifying selling pressure.
- The CLARITY Act's progress could reclassify Ethereum outside security regulations, possibly unlocking more institutional investment over time.
- Ethereum trades below key moving averages with increasing bearish momentum, likely to range between $2,150 and $2,350 near term.
Institutional outflows and policy reforms as selling pressure persists
Spot Ethereum ETFs saw net outflows totaling $183 million this week, directly reducing institutional liquidity and exerting measurable downward pressure on the asset. Progress on the CLARITY Act, which would grant Ethereum a unique regulatory status and exempt it from being treated as a security, has been reported, potentially removing a long-standing legal barrier and opening pathways for greater institutional participation. Separately, Ethereum network governance has begun reviewing a proposal to cap staking rewards at certain thresholds to help curb token inflation, a move supported by Grayscale Research, though price action has remained under broader selling pressure.
Mixed momentum signals as ETH tests resistance and volatility rises
ETH is trading just below the SMA-50 at $2,247.72, under the SMA-20 at $2,312.61, and far below the long-term SMA-200 at $2,630.05. The Ichimoku Kijun at $2,322.06 represents immediate resistance. Momentum oscillator readings are mixed: the D1 MACD signals a strong buy, while the ADX indicates an unclear trend. RSI (49.73), Stoch RSI (34.17), and CCI (–72.83) register mild oversold conditions, while BBP shows a recent overbought phase with buyers initially controlling momentum. The Awesome Oscillator does not significantly reinforce the current move. ETH opened with a slight gap up at $2,284.03 before declining to close near the session low, highlighting moderate volatility and selling pressure throughout the day.
Sideways bias with downside risk as trend signals weaken
ETH is expected to trade within a typical volatility band between $2,150 and $2,350 over the next five days, reflecting recent price swings. The probability of a near-term rise remains low, at less than 20%, as indicated by weak signals from weekly and daily trend indicators. The baseline scenario favors sideways movement within this corridor, with a break above $2,322 required to trigger upward momentum, while a drop below $2,150 would open a path for further downside. Overall risk remains skewed toward continued decline unless meaningful buying activity resumes.
Earlier, analysts noted that Ethereum faced ongoing bearish pressure amid limited institutional inflows and mixed technical momentum. Recent developments surrounding the CLARITY Act and network governance reforms introduce potential long-term catalysts, but until renewed buying emerges, traders should closely monitor the $2,322 resistance and $2,150 support as pivotal levels for directional shifts.


Latest Ethereum News


-
 Afghanistan
-
 Albania
-
 Algeria
-
 Angola
-
 Argentina
-
 Armenia
-
 Australia
-
 Austria
-
 Azerbaijan
-
 Bahamas
-
 Bahrain
-
 Bangladesh
-
 Belarus
-
 Belgium
-
 Bolivia
-
 Botswana
-
 Brazil
-
 Brunei
-
 Bulgaria
-
 Cambodia
-
 Cameroon
-
 Canada
-
 Chile
Chile
-
 China
China
-
 Colombia
-
 Congo
Congo
-
 Costa Rica
-
 Cote d'Ivoire
-
 Croatia
-
 Cuba
Cuba
-
 Cyprus
-
 Czechia
-
 DR Congo
-
 Denmark
-
 Dominican Republic
-
 Ecuador
-
 Egypt
Egypt
-
 El Salvador
-
 Estonia
-
 Eswatini
-
 Ethiopia
-
 Finland
-
 France
-
 Georgia
-
 Germany
-
 Ghana
Ghana
-
 Greece
-
 Haiti
Haiti
-
 Hong Kong
-
 Hungary
-
 India
India
-
 Indonesia
-
 Iran, Islamic republic
-
 Iraq
Iraq
-
 Ireland
-
 Israel
-
 Italy
Italy
-
 Jamaica
-
 Japan
Japan
-
 Jordan
-
 Kazakhstan
-
 Kenya
Kenya
-
 Korea
Korea
-
 Kuwait
-
 Kyrgyzstan
-
 Laos
Laos
-
 Latvia
-
 Lebanon
-
 Lesotho
-
 Libya
Libya
-
 Lithuania
-
 Luxembourg
-
 Madagascar
-
 Malaysia
-
 Malta
Malta
-
 Mauritius
-
 Mexico
-
 Moldova
-
 Mongolia
-
 Montenegro
-
 Morocco
-
 Mozambique
-
 Myanmar
-
 Namibia
-
 Nepal
Nepal
-
 Netherlands
-
 New Zealand
-
 Nigeria
-
 North Macedonia
-
 Norway
-
 Oman
Oman
-
 Pakistan
-
 Palestine
-
 Panama
-
 Papua New Guinea
-
 Paraguay
-
 Peru
Peru
-
 Philippines
-
 Poland
-
 Portugal
-
 Puerto Rico
-
 Qatar
Qatar
-
 Reunion
-
 Romania
-
 Rwanda
-
 Saudi Arabia
-
 Serbia
-
 Singapore
-
 Slovakia
-
 Slovenia
-
 Somalia
-
 South Africa
-
 Spain
Spain
-
 Sri Lanka
-
 Sweden
-
 Switzerland
-
 Syria
Syria
-
 Taiwan
-
 Tajikistan
-
 Tanzania
-
 Thailand
-
 Trinidad and Tobago
-
 Tunisia
-
 Turkey
-
 UAE
UAE
-
 Uganda
-
 Ukraine
-
 United Kingdom
-
United States
-
 Uruguay
-
 Uzbekistan
-
 Venezuela
-
 Vietnam
-
 Yemen
Yemen
-
 Zambia
-
 Zimbabwe
- Forex
- Crypto
