
Sui drops 7.29% as sellers dominate below long-term price range

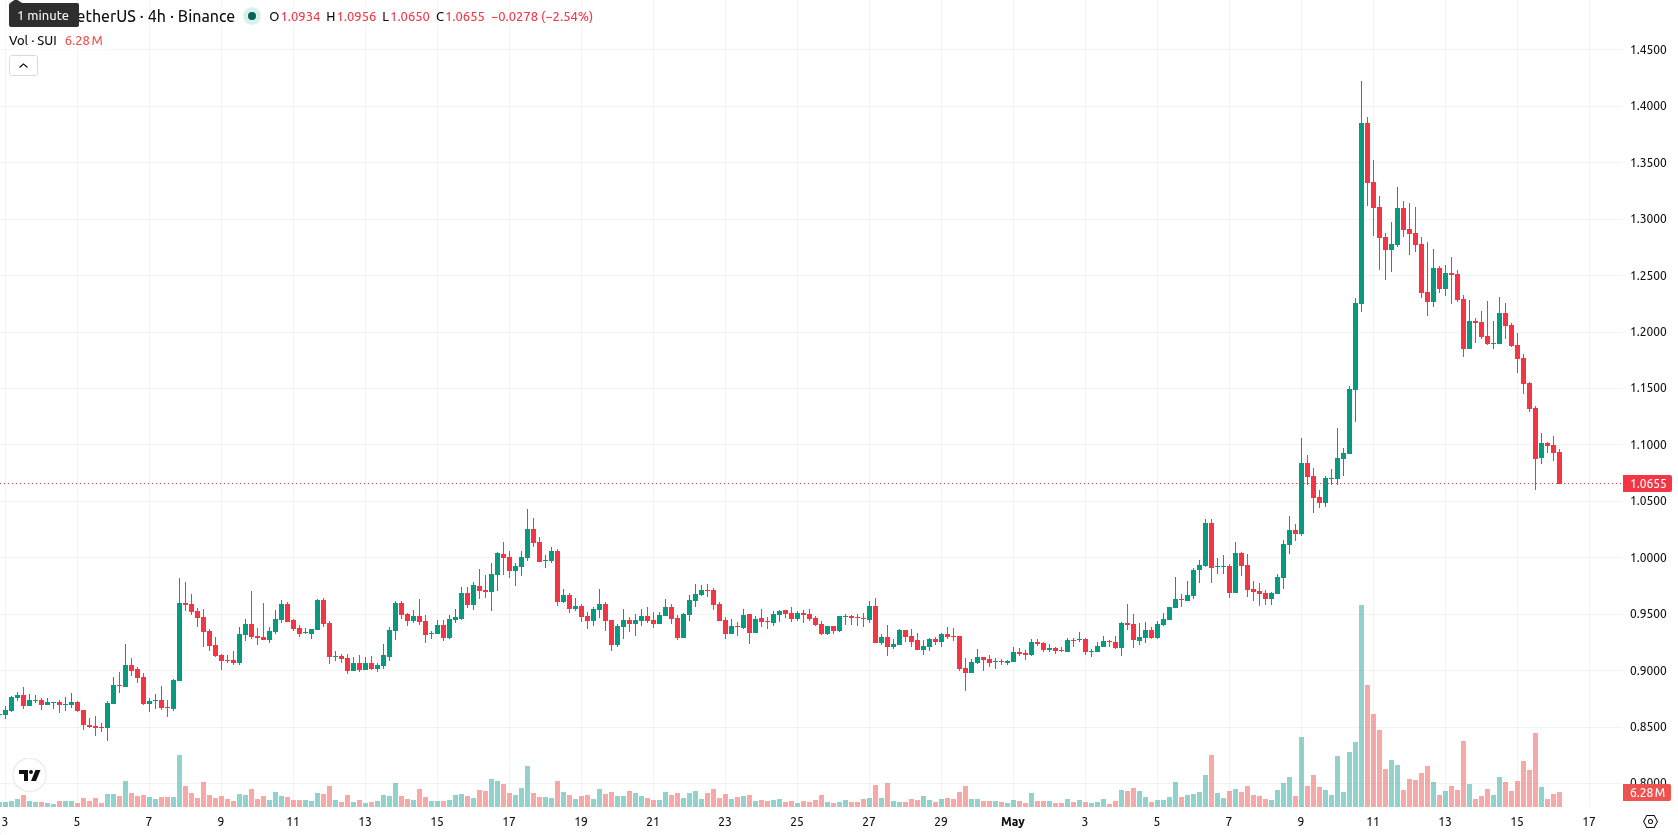
Sui (SUI) is trading at $1.0689 today, down 7.29% from the previous session. The price sits above its key short- and medium-term moving averages, but remains well below longer-term averages.
Highlights
- Sui Foundation's launch of Sui Spheres enables institutions to deploy private, regulator-friendly blockchain environments interoperable with the public network.
- Over 75% of SUI tokens are now staked, paired with upcoming US spot ETF approval and CME futures listing, tightening available supply and institutionalizing the asset.
- SUI price trades in a volatile $1.02–$1.15 range with mixed indicator signals, as downside pressure dominates and sustained gains are unlikely without a breakout above $1.15.
Supply reduction and institutional demand underpin outlook as Sui Spheres launch
The Sui Foundation launched Sui Spheres on May 15, 2026, allowing institutions to operate private blockchain environments that connect with the public Sui network, opening new compliant and high-throughput use cases for banks and corporates. More than three quarters of all SUI tokens have been locked in staking following a publicly listed company’s move to stake its 108 million SUI treasury, reducing liquid supply. Regulatory developments include the approval of spot SUI ETFs in the US and an upcoming SUI futures listing on CME Group, while confidential transaction features are reported to be nearing mainnet launch — though price action has remained under broader selling pressure.
Conflicting momentum builds as volatility and resistance levels converge
SUI trades above the SMA-20 ($1.0346) and SMA-50 ($0.9648), while remaining below the SMA-200 at $1.3018. The Ichimoku Kijun level on the daily chart is $1.1519, marking near-term resistance. Momentum indicators present a mixed landscape: MACD and ADX suggest mild bullish momentum, whereas daily RSI and CCI are in neutral to slightly bullish territory. Stoch RSI signals an oversold condition, with BBP positive intraday but most shorter timeframes showing persistent selling. Volatility remains elevated, with the price near the day's lower range ($1.0774–$1.1065) and clear evidence of downside pressure after the session open.
Sideways drift likely as volatility constrains decisive breakout
For the next five sessions, SUI is expected to fluctuate within a $1.02–$1.15 range, reflecting a volatility band relative to current levels. The scenario with the highest probability is sideways trading between $1.02 and $1.15 as bulls and bears compete for control. A breakout above $1.15 could trigger a short-lived upward move, while sustained action below $1.02 would confirm further downside amid continued selling momentum on higher timeframes.
Earlier, analysts noted that persistent technical resistance and bearish momentum were capping Sui’s recovery despite ongoing ecosystem development. Recent regulatory advances, institutional staking activity, and continued volatility add a new dimension to the outlook, with the $1.15 level now serving as a critical threshold that could shift momentum if breached.


-
 Afghanistan
-
 Albania
-
 Algeria
-
 Angola
-
 Argentina
-
 Armenia
-
 Australia
-
 Austria
-
 Azerbaijan
-
 Bahamas
-
 Bahrain
-
 Bangladesh
-
 Belarus
-
 Belgium
-
 Bolivia
-
 Botswana
-
 Brazil
-
 Brunei
-
 Bulgaria
-
 Cambodia
-
 Cameroon
-
 Canada
-
 Chile
Chile
-
 China
China
-
 Colombia
-
 Congo
Congo
-
 Costa Rica
-
 Cote d'Ivoire
-
 Croatia
-
 Cuba
Cuba
-
 Cyprus
-
 Czechia
-
 DR Congo
-
 Denmark
-
 Dominican Republic
-
 Ecuador
-
 Egypt
Egypt
-
 El Salvador
-
 Estonia
-
 Eswatini
-
 Ethiopia
-
 Finland
-
 France
-
 Georgia
-
 Germany
-
 Ghana
Ghana
-
 Greece
-
 Haiti
Haiti
-
 Hong Kong
-
 Hungary
-
 India
India
-
 Indonesia
-
 Iran, Islamic republic
-
 Iraq
Iraq
-
 Ireland
-
 Israel
-
 Italy
Italy
-
 Jamaica
-
 Japan
Japan
-
 Jordan
-
 Kazakhstan
-
 Kenya
Kenya
-
 Korea
Korea
-
 Kuwait
-
 Kyrgyzstan
-
 Laos
Laos
-
 Latvia
-
 Lebanon
-
 Lesotho
-
 Libya
Libya
-
 Lithuania
-
 Luxembourg
-
 Madagascar
-
 Malaysia
-
 Malta
Malta
-
 Mauritius
-
 Mexico
-
 Moldova
-
 Mongolia
-
 Montenegro
-
 Morocco
-
 Mozambique
-
 Myanmar
-
 Namibia
-
 Nepal
Nepal
-
 Netherlands
-
 New Zealand
-
 Nigeria
-
 North Macedonia
-
 Norway
-
 Oman
Oman
-
 Pakistan
-
 Palestine
-
 Panama
-
 Papua New Guinea
-
 Paraguay
-
 Peru
Peru
-
 Philippines
-
 Poland
-
 Portugal
-
 Puerto Rico
-
 Qatar
Qatar
-
 Reunion
-
 Romania
-
 Rwanda
-
 Saudi Arabia
-
 Serbia
-
 Singapore
-
 Slovakia
-
 Slovenia
-
 Somalia
-
 South Africa
-
 Spain
Spain
-
 Sri Lanka
-
 Sweden
-
 Switzerland
-
 Syria
Syria
-
 Taiwan
-
 Tajikistan
-
 Tanzania
-
 Thailand
-
 Trinidad and Tobago
-
 Tunisia
-
 Turkey
-
 UAE
UAE
-
 Uganda
-
 Ukraine
-
 United Kingdom
-
United States
-
 Uruguay
-
 Uzbekistan
-
 Venezuela
-
 Vietnam
-
 Yemen
Yemen
-
 Zambia
-
 Zimbabwe
- Forex
- Crypto
